Wednesday, May 1, 2024

Has S&P500 peaked yet?

Why do we care? 

Historically, when US markets sneeze, we catch a cold.
Global stock markets are so interconnected these days.  US stock market remains the largest in the world, everyone still looks at it, including Malaysians.
The US stock market has been in a long term bull run since the low of the Global Financial Crisis (666.79 in Mar 2009), it's more than 15 years of bull run now, the question is when is the next one coming?
If Tech Crash and GFC repeats, we could be in for a reasonable winter lasting over 1-3 years potentially, if history is a guide, even if notoriously unpredictable.


What are the Predictors of US stock market crash?

Firstly, nobody can successfully predict a stock market crash consistently all the time.  There are some general principles, but translating that to accurate timing / peak levels is extremely difficult.  Some considerations:

1. Over-valuations.
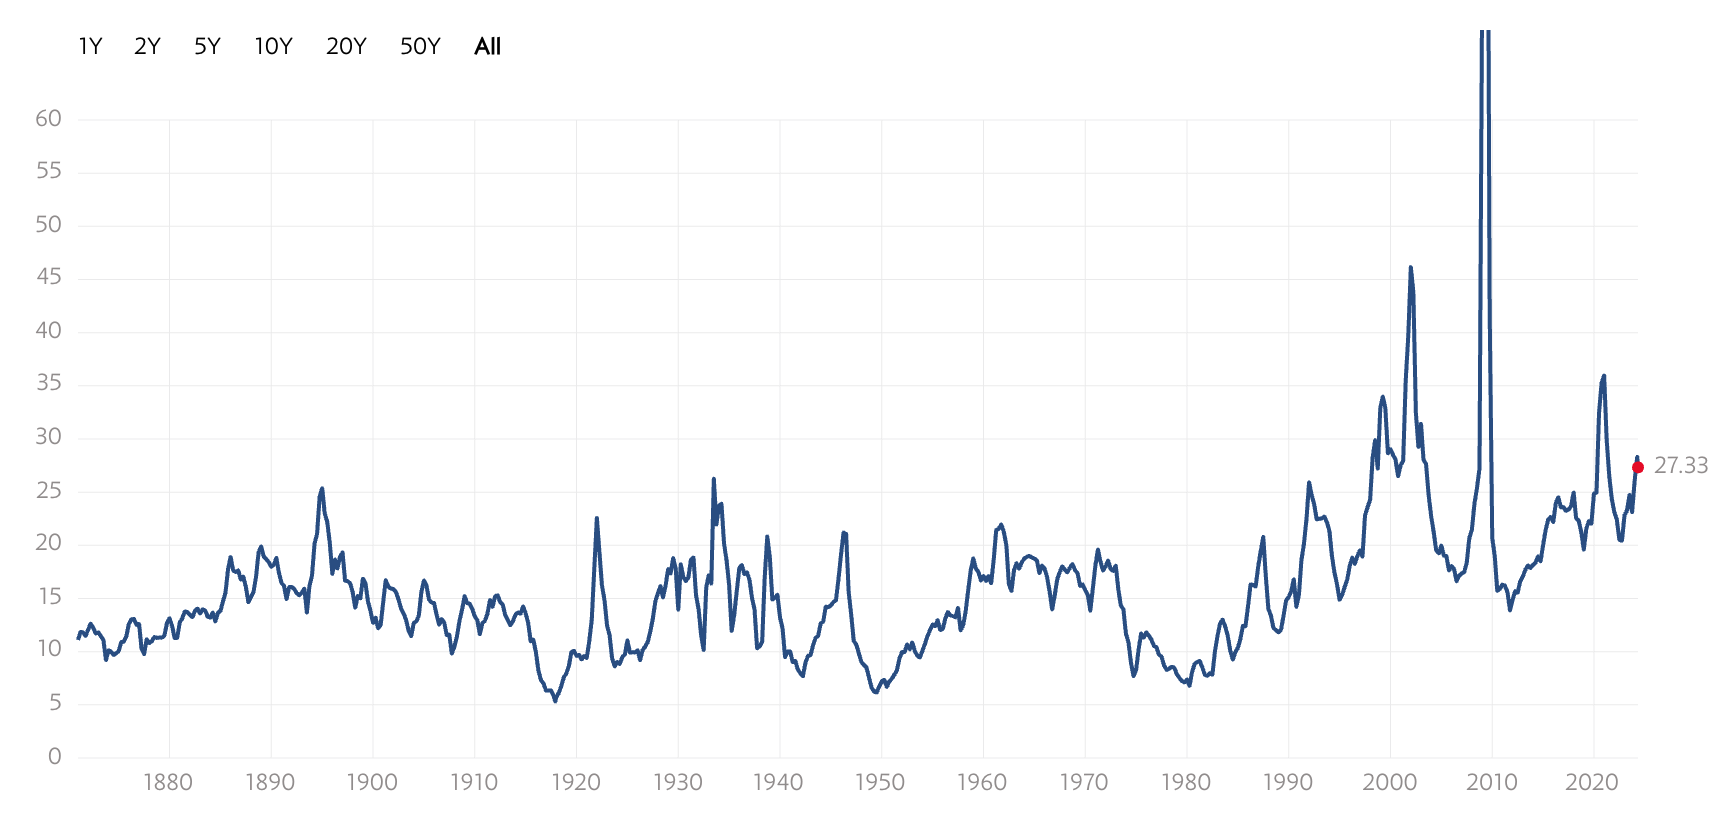
The trouble with this is that market peaks at different P/E levels historically, so, there's no one single magic level.  Here's some ideas:

See the peaks? Since 2000, the peaks have gone much higher than prior peaks.  That's one difficulty.  Second difficulty is that peaks normally occur when EPS is depressed and at its lowest i.e. predictors of market bottom rather than peaks.  Somewhere in between is when markets - which looks ahead - peak first before the economic recession/difficulties comes in to depress earnings.  Not so easy.  
So, where's the US market right now?  

Looks to me, it's not near peak yet?  E.g. compare to Covid peak in Q4/20 when it hits 30.  Recall around this time, Malaysia and other countries have been in global lock-down for quite a while, economic activities hit hard, earnings at the lowest and not surprised that P/E peaked.  But prices have already came down hard, a bit too late isn't it?
EPS lowest in Q1/2020, when lockdown first started.  However, note today's EPS is so much higher than in 2019 before COVID.  So, US earnings is still resilient.  Note Fed funds peaked for over a year already.  The Feds are doing a good job so far, balancing interest rates with economic activity.  We now have the longest ever period of an inverse yield curve, and we still haven't seen earnings taking a significant dive.

2. Economic indicators?
Which one?
Can you act on it timely enough, or too late?
Where is the threshold level?
How do you interpret this?

Let's start with US GDP growth.  
FYE2023 looks normal at 2.5%.
But most recent April figure is 1.6%.
Where is the threshold level to be concerned and start selling? (I don't know).

Honestly, I can't really use it timely.  I can't use this to accurately predict historical market crashes in advance before everyone else.  By the time I see it, 99.99% of the time, I'm quite certain market prices have already moved.  In short, this is lagging for me.

The wierd thing is last time during 2009, there's that negative bar and the stock market after 2009 has only been wonderful.   In COVID 2000 negative bar, we've only see 3 positive bar so far, so, a valid question is why can't this market keep running over next few years?  I really don't know.


Let's try another one - US unemployment rates.
This chart is not telling me anything new.  All I see is the Covid spike i.e. when most countries are on lock down, unemployment went up to very high levels and today's level doesn't quite bat an eyelid.  Hard to get excited by recent figures isn't it?  What would you do?  Buy more or sell more?  I don't know.

Let's try another one - US inflation.

Past 10 years.  The right bar doesn't look like it's at an extreme level?  How do you interpret this?  When inflation peaked, markets didn't crash.  When it bottomed in 2020, that we already know due to Covid and high unemployment, low GDP activity i.e. hard for inflation to happen when there's so little monies circulating around notwitstanding lower economic activity.  A lot of these type of analysis sounds sophisticated, but how to use it to make money?  I don't know how.  (Hence, I usually end up ignoring a lot of these indicators, because it never helped me to make money).

3. Inverse yield curve
Historically, this one is perhaps one of the more reliable indicators in the sense that when it happened and when it is prolonged, it appears to foretell stock market crash.
Why?  Well, look at it.  Inverse means short term yields are higher than long term yields, the opposite of what normally happens.  In normal times, market requires higher yields at longer duration, to be rewarded sufficiently for higher uncertainty.   So, when it's inverted, it means market demands higher interest rate over the near term because it's expecting even greater uncertainty short term and needs to be rewarded for the higher uncertainty short term.  What is uncertain short term?  Lower economic activity short term?  Stock market crash?
Certainly, higher short term interest rates doesn't help businesses.  They have to pay higher interest costs, depressing their profits.  This can trigger recession if prolonged.
Certainly, banks will find it difficult to raise funds.   They have to borrow long (lower yields) to lend short (higher rates) which increases their risks.  This can depress their stock prices when banks takes higher long term risks. 
So, you have this situation that is precarious - nobody likes it.
So, you might be thinking -  the longer this happens, the higher the chance of recession?
And the market has been on the longest every inverse yield curve today since 1980s.
But when everyone expects it, will market crash?
Are they "just waiting" for the herd to run out of the gates?
It's too obvious, yet, there seems to be some fundamentals behind this.
Can markets defy fundamentals forever?
Markets always eventually crash.  The only questions are when and how big?
This one plus all others does signal caution.  For retirees especially without an active income and relies on savings, you cannot afford to be aggressive now.  
But there's no law that says that this inversion cannot last for a few more years, or last for another month.  Anything can still happen.


4. The Feds - Interest Rate and Monetary Policy
I recalled reading that the official Fed position is that they expect 3 rate cuts this year, but so far, nothing yet.  Why rate cut?  Well, they need to do something with the huge debt in the US balance sheet.  The world holds their bonds, they can't keep paying high rates externally.  The only fear is spurring further economic activity.  An economy that is too strong also has problems.  So, market takes a dip in anticipation of the upcoming Fed meeting, but as usual, the uncertainty spikes up before Fed meetings and then normalize.  Longer term, it's 50/50.  If rates are cut, the bears will say that this is proof that Fed sees recession coming and so need to spike up the economic activity via lower interest rates.  Bulls will say this is proof that the Fed acts in advance and will continue to manage the economy well i.e. the crash is pushed back further and further into the future.  It's all interpretations and herd behaviour i.e. I really don't know how to use this to predict future market movement.

Chart wise, yes it dips after hitting that strong Fibonacci resistance, but that's expected.  But will it predict a crash coming next?  I don't know.  But I have a plan if it comes and a plan if it doesn't come.

5. Geopolitical risks?
Recently, the Israel-Iran drone attacks seem to cause some worries of escallation that might speak contagion.  The Israel Hamaz Gaza related conflicts.  etc.
But taking a contrarian position, aren't these conflicts happening all the time?
Also, remember 911?  When markets crashed, aren't those the best time to buy and then sell when the conflict is no longer a conflict?
To me, that's a noise.

So, what characterize a market crash?
For me, it has to be price levels.  Price Charts.  A significantly lower prices over a prolonged period.
And that must be an opportunity.

How to capitalize a market crash?
This is when good quality businesses run by able management is sold at an attractive price.  As Buffet says, this is the time when he feels he is the only guy in a harem full of beautiful women.  He doesn't know which one to choose.  Everything feels attractive.

Nevertheless, not all businesses are the same.  Some gets hit harder and that's when they become more attractive if they have stronger recovery power.  During crash, dividend yields rise but what you are after is the subsequent price gains.  Your mindset need to shift a little.

The market values of your existing stock holdings will reduce.  However, you are diversified and you own good quality businesses.   So, the fall is normal and no need to panic.  Their dividend yields will rise and comfort yourself that your income is still there, maybe dropped a bit but future price gains is even more attractive.

As market values of stocks reduce, they will become a smaller proportion of your Net Worth, as your EPF, your FD, your property values are fixed and immune to the fall.   If they are previously 33% and market values fall 10%, they reduce to 30%.

In the first 6-12 months after seeing the peak in the market, typically around this time, this is when you start to consider buying the bargains, to raise it back to 33% i.e. rebalancing.  A lot of people will start shouting cheap, but ignore them.  It means real fear hasn't happened yet.

However, near the bottom (typically longer than 12 months of depressed prices), it's time to increase that 33% to a higher %.  By this stage the voice that shouts bargains have dropped.  That's when real fear comes in.

Volatility will be extremely high - typically highest.  VIX will typically spike up.  That's the time to start adding the 33% to be a higher number like 40%. 
 
Volatility is so high, typically, you will miss the timing because it's so damn volatile.  

There is no guarantee of recovery, but eventually recovery will happen in years to come.  It's not tomorrow, it's not next week, next month or even next year.  To get the biggest bang for the buck, we are talking several years.

Meanwhile the advantage of buying high dividend yield stocks is that the dividend income can sustain you and likely to be more than what you'll need.  The lows will give you a chance to own many more shares.

And many years later, the price gains will come if you have holding power and can hold for many years after.  Good quality businesses will recover, when market normalize later, even if very hard to see then.  This is when you will probably look at increasing your dividend income by another 5% --> 15% --> 25% ---> 50% -->100% depending on how bad the crash is and how well you play this crash.  This is also when you will have days and nights when you cannot sleep due to the massive volatility.  This is when you feel suddenly very rich after recovery, only to experience very huge falls causing you to feel regret, and when you least expect, the recovery makes you feel very rich again.   All this if you keep watching the stock prices too closely.   The fabled "emotional roller-coaster".  Not helpful.

Instead, as dividend investors, anchor ourselves in the dividend income.  Keep adding that dividend income.  Only after you are sure you've seen bottom, shift some of the dividend income into price gains.  The price gains will be spectacular.   Keep a lookout at warrant prices but unlikely you will be able to take advantage of that as typically, the issuers are also on the same lookout and looking to make a killing too.

All these are just speculations.  Some based on prior experiences of several market crashes but every crash is different.  It never turns out the way you expect it.  I was too young to remember the Oct 1987 stock market crash but old enough to read it in the newspapers and see its effects.  I remembered the Tech Crash and was lucky enough to participate in the recovery but my portfolio was far too small to make a difference to my life.   Every crash after that was different.  The last one was Covid where I missed the opportunity due to life and work issues, so, just because you know doesn't mean you are able to catch it.  

Being ready for it mentally and having the financial resources ready for a crash is not easy.  Group think rarely helps.  Critical to think and act independently and quietly.

It's easy to write this when markets are near all time high in the US.

Will Malaysia stock market crash when US crashes?
Even though the opening statements said that when US sneeze, we catch a cold, that statement is not entirely factual nor always true.  There are periods of convergence and divergence.


In short, nobody knows in advance, everyone knows in arrears.

Summary and Conclusion
Has S&P500 peaked yet?
Short answer is not sure - maybe it's at its last quarter of its long bull run of many years since GFC, but hard to say more precisely than that.  The inverted yield curve can't last forever, and everyone is looking out closely too, so, maybe it can last longer this time?

Will a US market crash cause KLSE to crash?  
Short answer is that whilst there is more convergence than divergence, historical data suggests that because the US market is so large, it typically has an impact across the world including Malaysia, although the extent may not be that large in Malaysia (e.g. Tech Crash was bad in the US, not so bad in Malaysia).  But it's not full-proof and I won't be surprised with either outcome.

We can't avoid significant falls in market values if US S&P500 crashes.  KLSE will follow, maybe lesser extent.  Your diversified dividend stocks should also fall, maybe lesser extent.  Diversification does not immunize your portfolio because > 50% of the price driver comes from market falls.  Expect FD rates to rise and expect EPF returns to fall if EPF didn't manage well.

Your EPF and FD proportion will rise as a % of your Net Worth, as your stock % falls.  During bull markets, it's the reverse.  So, when the reverse happens, this is the time for very careful monitoring and execution of averaging down and increasing the % in stocks.  Nothing extreme, because you still have to live but despite the huge volatility (VIX all time highs perhaps) and extreme fears and extreme aversion to stocks, when people stops calling buy the dips or buy the fears, that's when you should be looking out.  The first few calls to buy the dips should likely be ignored.

Anchor on the dividend income.  Those will likely dip a little too, so, look to add to keep it stable initially when it's significantly cheaper.  No absolute criteria. Everything is relative and dynamic at the time.  Experience and sense matters.  Seek calmness and quiteness when everyone around you are panicking.  No blind averaging down, you will easily spend too much cash buying.  You won't catch the bottom in any significant manner.  It is okay to leave the buys on the way up.  Cash is King during this period.   Bear markets don't last very long, maybe 3 years at the most.  Vast majority of people runs out of cash, and vast majority of people will be too afraid to utilize the little cash they have left. 

Most of your dividend stocks are intended for rising dividend income over the long term (> 10 years). Anchor on the business and the future dividend income.  Price gains may be the largest but ultimately, they are still bonus.  You actually don't need to do anything.  Hence, any price gains actions are bonuses.

Be prepared, good luck when it comes one day (if you can still remember this article)!

Buffet's Rule No 1 and 2 - Never lose Money

 These are probably the 2 most important rules of investing.

"The first rule of an investment is don't lose [money]. And the second rule of an investment is don’t forget the first rule. And that's all the rules there are."


But why?  Why are these the only 2 rules of investing?

Personally, to me, there's a few reasons - beyond stating the obvious that nobody wants to lose monies in investing.

Reason #1 - The retiree with a large EPF without active income.

For this segment of investor, if they are not ultra wealthy (i.e. they still need investment income to cover their lost salaries due to retirement), then, they will be in a permanently precarious position when lose monies because they then have to dip into their capital to spend to live, i.e.

1. There will be a permanent reduction to investing capital, and

2. To provide the same level of investment income as before, they need to target an even higher % returns that comes with higher risks of losing money.

Hence, for these investors, Buffet's Rule No 1 is critical.

Reason #2 - Returns Asymmetry:  If you lose 50% capital, a gain of +50% capital won't get you back to original capital.

This is an often forgotten concept, but mathematically, if you start with RM1 million and you lose 50%, the remaining principal is only RM500,000.

Then, if you want to grow RM500,000 back to RM 1 million, then, +50% return is insufficient.  This is because 500,000 x (1 + 50%) = 750,000 only.  

To get back to RM1,000,000, you need +100% returns.

This is the main reason why you should not dig a big hole, when it comes to wealth accumulation.

A small loss like -5% requires +5.26% returns to get back to 100% since (1-5%) x (1+ 5.26%) ~ 100%.

However, a big loss like -50% requires +100% returns to get back to original capital, since (1-50%) x (1+100%) = 100%.

This is simple mathematics - you must fully integrate this understanding into your subconscious.

Reason #3 - you have many other investment alternatives that doesn't lose monies

3 examples:

1. Put the money into savings account with a solid bank insured by PIDM and earn low interest.  Ask your parents, your grandparents, ask your relatives, ask your friends, ask how many of them lose monies  because they put monies in their savings account, and odds are, you will struggle to find one that has actually lost monies.  

2.  Put the money into fixed deposit with a solid bank insured by PIDM.  Again, ask the same people and ask how many of them lost monies vs investing in stocks and odds are, you will find nobody has lost monies yet when they put monies into FD.  They may lose out in some years to inflation, but they haven't lost monies like they lose in the stock market.

3. Put the money into EPF before age 55 and by the time you turn 55, you can always withdraw like a bank account (perhaps delay a few days for processing but no major drama if plan ahead).   Ask 100 people with real life EPF account and ask how many of them have lost monies.  Ask 55 and 60 year olds today how many have lost monies.  Ask 70 and 80 year olds today if they have lost monies.  Odds are, you won't find anyone.   Sure, there are always the doomday sayer who says EPF is a ponzi scheme and so on, but Malaysia EPF is not that extreme.  If you are approaching retirement today, EPF is still your safest and best investing vehicle for literally doing nothing.  On the other hand, if you are a fresh graduate entering the workforce, it doesn't harm you to diversify i.e. contribute to EPF and spare some monies for other ways of investing, such as savings in FD to plan to buy your own home that appreciates in value, assuming you own a basic car that will get you from A to B at reasonable cost.

Other examples is buying your own home to live in.  

Or invests in real estate property (a 2nd home, or more) but don't over leverage.  The value of a property appears stable due to lack of revaluation but it doesn't mean it cannot go down in the short term, although wait long enough (and assuming you don't over-pay like buy at the peak of the market, don't over-leverage like borrowing too much, unable to service interest and principal causing forced sell, don't make poor decisions like buying at a poor location), eventually, they will go back up (the uncertainty is timing).  Ask 100 people who actually bought prudently and held for a long term (at least 10 years) and the vast majority if not all wins (provided they don't over-pay, don't over-leverage and don't make poor buying decisions).   

Or invest in a diversified portfolio of a sound, growing, profitable businesses managed by above average management that can be purchased at an attractive price, that pays a stable % of earnings in dividends, combined with EPF + FD to take advantage of the rare stock market crashes. (this is harder to do than it sounds, but easier to do than it looks).

So, you really have so many alternatives that don't lose monies, hence, why should you lose monies in equities?

Reason #4 - if your equity investment goes to zero, you can never recover back.

This applies to the popular warrants / derivatives in KL stock market, and sometimes to the seriously speculative stocks.  

The thing is these warrants usually cause the vast majority of speculators to lose monies.  The number of speculators who eventually leave the warrant market far outnumber the extremely few speculators who are still punting and claimed to make money since Day 1 (likely, vast majority here are faking).  

Sure the gains can be occasionally be spectacular but do this long enough, and ask 100 players and vast  majority lose monies.  And in too many cases, these warrants goes to zero at expiry date.

The problem is greed + hope combined with leverage.  These are lethal combinations that is sure to cause you to lose monies in the long run.

Another famous Buffet quote:

Having a large amount of leverage is like driving a car with a dagger on the steering wheel pointed at your heart. If you do that, you will be a better driver. There will be fewer accidents but when they happen, they will be fatal.

Another Buffet and Munger concept:

Reason #5 - 2 x 2 x 2 x 2 x ..... x 0 = 0

What this means is that no matter how many times you doubled your money in the past, all it takes is 1 time of -100% and your entire capital is lost permanently, forever with no chance of getting back into the game.

Reason #6 - you PERMANENTLY lose time to recoup losses and make gains

When you are young, time may not seem important to you, especially when you think you have lots of it.  But as you get older, you will learn that Time = Money.   

Those sensitive to time and safe returns know that it takes a long time to double your wealth via FD returns.  E.g. if FD earns 3% per annum, it takes 23-24 years to double your monies, so, if you lost 50% of your capital due to poor investment in speculative stock / warrants and avoid equity market altogether, it will take you 23-24 years to recoup that loss back, because you will have realized that losing 50% requires +100% returns (or doubling your monies) to recoup back your original investment.

That's an awful long time that has been permanently lost!

Other Rationalizations

Two popular rationalizations.

#1 Tuition Fees.

Sometimes - especially investment "educators" like to quote this - you never actually lose monies because you are paying "tuition fees" to the market.

On one hand, it's a positive thing to look at your losses and there's mental and emotional benefits for thinking like this.  It retains your sanity.

However, it is still a permanent loss.  The point is - in investing, there is really only ONE score-card.  Your P&L.  Everything else is excuses.  If you don't grow your monies in the equity market after a reasonable period of time, it means you are not suited for investing or trading and you are better off giving your monies to the professionals to manage than DIY yourself.

Your so called "tuition fees" are far too expensively paid.  I paid less than RM50-RM100 per lesson on my kid's tuition, you should not need to pay 10 times more for your investing "lessons", no matter how much these "educators" promised you will earn in return after "learning".  Sadly, there are some investors who has lost 5 digits, 6 digits or even more in the market and then had to leave the market permanently with that kind of losses with no chance of recouping.  That kind of lesson, when compared to studying Finance and Investments in Universities, are far too expensive and far less useful.  At least, with a degree in Finance or Investments, you can still look for employment and a salaried employment income!  With those ridiculous fees paid to "educators" for 3 or 5 or 7 day courses, which promises "financial freedom", which reputable financial institution would want to hire you and pay you a monthly salary after you "graduate"? 

#2 At least I beat the market

Another famous rationalization is - "at least I don't lose as much as the market" or "I beat the market".  Yes, market lost 20% and you lost 18%, so, you beat the market by 2%.  Wonderful!  But is it really?  

Again, you started with RM1 million, and now, you lost 18% and your capital shrunk to RM820,000.  You beat the market by 2%.  Are you happy?

For me, the answer has to be a resounding No!  No, I am not happy!  Unless this is a temporary loss, with a very high probability that I will eventually beat EPF / market (whichever is higher) by the same margin!  In other words, generalized excuses doesn't cut it for me.   

There needs to be a very high probability strategy, that will put me ahead by at least the same % win if not more.  If I take -20% risk, I want a return with very high probability (at least 75% probability) of eventually gaining +20% returns or more.   At least 3 to 1 win to lose odds, if not 5 to 1 or 10 to 1 odds, or better!   75% probability is the absolute minimum.   I prefer 95% chance of gaining 20% if lose 20%.

Long term successful business people don't gamble with 50-50 chance.  The really good ones already win when they enter the game.  To them, their combined business ventures and combined business deals are not gambles but certain wins, even if individual deal may risk losing monies.   That's how you should approach investing.   Don't invest, unless you are certain that you will come out a winner in the final account after a reasonable period of time.

If you can't visualize with certainty how you will come out winning, don't invest.  Instead, park your monies in EPF and at least, this way, you can visualize with 100% certainty that 1, 2, 3, 5, 10 years from now, your EPF balance will be higher.

This is not saying that every stock you invest in will be a winner.  The goal is the final account balance that combines all the stocks that you invest/traded in.  It is the final account that matters.  Whether a minority stock wins (with majority losing) but the total grows the account in a huge way, over time, is far more important than the component performance of that account.


Thursday, April 25, 2024

TENAGA

A bit of trivia.  Fundamentally, TENAGA needs no introduction.  It's not the best fundamental business out there, but it's definitely above average due to its pricing power, even if not managed by the best quality management.


Started buying TENAGA on 28 Apr 2021, nearly 3 years ago.

  • Added 3 more times as indicated by the upward pointing triangles.
  • Then near resistance, sold a small amount.  Still retain 85% of purchase.

With this kind of price action and trades, as of 25 April 2024:

1. Total Returns = 15.18% per annum CAGR (Price + Dividends).

2. Total Price Returns (exclude Dividends) = 10.65% per annum CAGR

3. This suggests that the Dividend Returns = 15.18% - 10.65% = 4.53% per annum CAGR.

The Dividend Returns are solid - lower than EPF long term returns of 6% per annum, but still higher than FD long term returns of say 3% per annum.

But ... Price returns are even better - more than doubled the Dividend Returns.
That helps Total Returns a lot - especially the 2 buys near the bottom.  That's like tripling the dividend returns!

Moral of the story:

1. Invest, don't trade. (TENAGA charts are not that suited for trading)

2. Invest in above average quality dividend stocks for wealth accumulation.

3. Invest more when the price of this above average quality business is sold at an attractive price.  At the time, the dividend yield when I entered in my 3rd and 4th purchase was around 5.5% to 6% iirc.  

4. Position size is critical.  If neutral position size is 3% and you feel the price might go lower but not too sure, invest a portion of the 3% first.  The advantage is that when your price sense turns out correct, add more when price is lower.  You can do this without violating your position size rules.   

5. However, I didn't get a full 3% position on my last purchase.   I didn't look harder and didn't ask myself timely enough whether I've seen the bottom in TENAGA when price went above my first entry or prior.  On the uptrend, I should at least get a bit more to get to 3% full position size around July 2023.  (too busy with work).

6. Sold a small portion near the horizontal resistance, but price continues to break above that, so, this looks like good odds of an uptrend.   The best thing to do in an uptrend is to sit tight and do nothing.

7. Quick 1 second visual look - next resistance is probably near RM13 (weaker) and RM14 (stronger).  As these are longer term charts, there's no need to watch prices everyday.   Don't need to be precise, but glance once in a while.

Why sell a little bit?  

Things are not black and white.  Probably lowers total return for a long period (because cash drags), but important to have some cash because one day, markets are guaranteed to crash if one has a 5-10 year horizon.  When this happens, you will be glad to have cash.  And you have no idea on when this will happen.


Friday, April 5, 2024

CHINWEL

I think it's entering Accumulation Zone.  Position sizing is critical now.

Long Term Charts

The 61.8% Fibonacci level near 1.18 is a logical first entry.
There's a couple of downtrend line support below around 1.10 down to 1.00.
There's the 78.6% Fibonacci level near 0.96.
The patient long term investor will stalk his prey over the coming months.

Business Profile
Simply put, its 2 main divisions are fasteners and wires.  Historically, it's cash cow has been the fasteners products (wires lesser extent) but in recent times faces huge headwinds in both segments, which is why the stock price has taken a hit.  It also has a massive net cash, built up from windfall gains in recent years.  This is simply due to the cyclical nature of its business - some years faces tough times, other years huge windfall gains.  The most recent gain was spectacular, causing the company to turn from a company with sizeable debts for a decade, into a huge net cash in just 1 year.  The company was prudent - it paid off its borrowings, and also bought a subsidiary withfreehold land worth over RM62 million.  The land doesn't pay interest though, and probably won't be disposed, but it's worth something and not nil.

See image below - during 2022, it acquired a subsidiary with 62m worth of freehold land. Land by nature doesn't earn anything. 

Turning Point to huge Net Cash - 2022

Compare FYE2022 vs FYE2021.

The turning point is huge PBT 122m (2022) vs 32 (2021) or 90 million difference.

Also good receivable and good inventory management vs prior year further increases its cash.  Responsibly does the opposite with payables.  Good management during very good times (it's easy to be good management when one is flooded with cash).

Sometimes, I wonder if it's too good to be true ... (here, we have to trust the external auditors).


Huge Net Cash Today, but wasn't like this all the time

Today, Net Cash + Land = RM288 million, or RM0.96.

Two years prior, Net Cash = RM0.3 million.  (Was 2022 too good to be true? No reason to doubt yet from price charts)

There's no magic to this huge growth - they had a windfall year back in 2022 and in the last year faced huge headwinds.

Near Term Future Prospects Bleak causing short term analysts to miss the picture

That's one view.
I do hear other views questioning if the analysts actions - originally started with HOLD - and then briefly turned to BUY - followed by recent SELL - the question is isn't this type of action intended to shake off the weak holders?   
Regardless, we use these to our advantage.

Analysts Short Term Business Analysis is not wrong


I agree that short term, the key fastener segment sales volume looks subdued short term.  Earnings for Wires look bleak too and they are waiting for government contracts.  Overseas particularly from Europe is challenging, due to the conflicts there.  North America is holding.
Just look at last 3 months vs prior year and just see how volatile its business is.  2022 was bumper harvest year, 2023 is lean and will probably get leaner before it gets better again.

Here's another comparison past 6 months 2023 vs 2022.  The recent revenue fall is very real.  But this is what cyclical stocks mean.


Where is the source of optimism for the long term?

The business financials have clearly fallen hugely - big huge drops in revenues, segment profitability has turned from large positives to almost nil.  Why can't earnings turn negative in the coming months?  Why can't there be more pain?

The truth is nobody knows.  Odds are, it's probably not bottom yet.

Founder and Substantial Shareholder Actions

If you own this stock for the long term, you must know this guy - Mr Tsai Yung Chuan.  He's the founder since 1989.  His wife and his 3 children are directors and senior management.

He's not a very good market timer - some of his past acquisitions are at high prices.  However, his most recent buy at end Feb 2024 at 1.19-1.20 is close to price chart - the 61.8% Fibonacci level at 1.18.  The size is decent around 300k+ shares - a tiny amount for him, but still, not that small.  But he did buy bigger back in Feb 2022 at 1.56 before it shoots up to 2.00 but what he couldn't predict is that hardship that followed after a very good 2022 year.  Nobody has a crystal ball on what's going to happen in Europe, not even him.

Past 10 Years Fundamentals

The 10 year CAGR is not inspiring, but that's expected for a cylical business.
The NAPS grows 6% p.a. compounding and comparable to EPF, so, that's decent say B-
EPS and DPS depends on start year but the key is to note the huge 2022 EPS which was that bumper year that's unlikely to be repeated soon.  But if you have a 10 year time frame in this stock, then, it's very good odds to see a repeat over next 10 years.  Still, Buffet would prefer something better quality than this type of company, but if you time your purchase and sales, it could turn out to be similarly rewarding / better.

Trade Strategy and Position Sizing
We don't own cyclicals for its Long term Dividend Yield - that's self defeating, because cyclicals will have lean years leading to nil dividends and is not a suitable source of reliable yearly dividend income like EPF.  If you want stability of yearly income, invest in EPF.

The strategy with Cyclicals is Price Gains.  Simply put, buy when it is low, and sell when it is high.  Never lose sight of this fundamental goal.  Everything that Analysts say or what everyone else say in investment forums should be ignored.

The risk with this strategy is what goes low, can go lower.  I showed some price levels.  There are no guarantees with these price levels.  They can break, they can fall.

Your safety is intrinsic.  You know the business is worth 96 sen.  Excluding the land, it is worth 74 sen.  If price falls to these levels, or lower, you want to keep buying more, because this company has a long proven history to share profits with you.  However, to make sure your portfolio will keep making new all time highs, you don't want to have too huge a position size.

If neutral position size is 3%, at the bottom, it should not be more than say 5% portfolio.  I highly doubt it will sell at 74 sen, but if it does get there, we know getting to RM1.50 (or doubling) is many times more likely to happen over next 5-10 years.

Hence, I would aim to get to 3% portfolio near the 61.8% Fibonacci level.  

As price falls, my value will fall and I will slowly add to keep it around 3% and higher slightly.

  • Around 1.10, I may aim for 3.5% or more.
  • Around 1.00, I may aim for 4% or more.
  • Around 0.95, I may aim for 4.5% or more.
  • And below that, I may aim for additional 0.5% capital or more.
  • These are just high level thoughts.

They are not cast in stone - every quarterly report provides an opportunity to review the fundamentals of the company to re-evaluate if the business fundamentals have change.

In terms of target price, over next 5 years, getting to RM1.8 is very good odds.  Ignoring dividends, it should meet your 9% per annum return criteria.  It could take longer if global market enters a crash and recover.  It could be sooner too if the situation overseas resolve itself sooner. 

Risks with this strategy

The founder and his wife are both late 60s.  Typically, where the business is today is because of them.  The bumper year in 2022 is a typical result after many decades of getting ready for this.   It is safe to say that if the founder is no longer around, there will be disruptions that may have repercussions not only short term but potentially longer term.   Whilst their children have been in the business for a decade, this reduces the risk but doesn't eliminate the risk completely.  Hence, at the bottom, never own more than 5% portfolio.

The reliance on exports to Europe and North America, and reliance on Vietnam as inputs adds forex volatility risks but is also opportunity to diversify.   As I have a highly diversified portfolio, I'm fine with this and doesn't bat an eyelid.  Nobody can predict forex movements over the long term.

The stock price can stay low for a very long time, and for a strategy in cyclicals where dividend yields are less reliable, this could depress the portfolio returns longer than expected.   Fortunately, I don't need to the dividend income to spend yet, I expect to still have other sources of income over the next 5 years, it's a non-issue for me.

Whilst the company has a proven history to share profits with shareholders, the most recent nil dividend declared is slightly perplexing, as they always share 40% profits.  Once, during tough times, they shared more.  However, not a major issue because to me, I suspect management is trying to be responsible to send the message that the upcoming 6 months can be expected to be tougher i.e. don't expect earnings to be positive (i.e. nil dividends).   So, the base case is there may be better buying opportunities coming given this announcement of nil dividend.  In theory, as the next 2 quarter results are announced, watch out for price  divergence signs, especially if price doesn't go lower on negative earnings.

Stock market crashing always open up opportunities elsewhere.  Besides utilizing market crash cash reserves (these are held as cash solely to capitalize), it is a viable strategy to sell CHINWEL too, to raise cash and buy other stocks that will recover faster.   Likely CHINWEL will hold its value better than other stocks when market crashes, due to its high Net Cash position.  Hence, market crash and temporary loss in CHINWEL is very welcome opportunity!

Summary and Conclusion

1. Target 3% capital near 1.18.
2. Own a bit more at lower prices due to the high Net Cash position.
3. Never own more than 5% capital for this stock.
4. Have at least 5-10 year horizon for this stock.
5. Welcome broad market crash, which is opportunity to swap into better stocks that will recover faster after market crashes.

Thursday, April 4, 2024

FPI

 I like this stock from both fundamentals and long term chart perspective.


Long term Chart

Usually, the good ideas tend to jumped out at you, and the chart below just jumped out at me. 
Odds look high, that the long term investor is going to profit from this type of chart / price action, when combined with excellent fundamentals (but nothing is guaranteed in markets).


Past 10 years business performance

The past 10 year's CAGR looks good, but too good to be true from future perspective?  
True 2014 EPS and DPS starts from a low base but even if we look at 9 year CAGR for EPS or DPS, this stock has proven its superior past performance.
Nevertheless, the past doesn't guarantee the future (even if at least this company has proven itself in the past very successfully). 
It's a stock where we want to consider own a full position or more near the local bottom.


Note:

1. The current dividend yield is at least 7% per annum.  My personal long term assessment of its dividend yield is around 6% per annum, matching/beating EPF.  Very nice and good odds to be sustainable (although there may be a short term bump down).

2. It's Net Cash is around RM1.40, when price is RM3.13. 
This means net of cash, the business is valued at 3.13 - 1.40 = 1.73.   
My long term assessment of its EPS is around 25 sen, factoring in the upcoming bump (even if TTM EPS is around 45 sen). 
If you assume EPS=25 sen first, the business is available for sale with a P/E of 6-7 times only. 
If you assume TTM EPS of 45 sen, the entire business is available for sale with a P/E of 4 times only.
Either way, whether 4, 5, 6 or 7 times, it is a very undemanding valuation. 
The cheapness (Price vs EPS) just jumps out at you.

3. This company has proven to have grown its Net Cash over past 10 years.  It's clearly above average, good to excellent quality business over the past 10 years.  

4. The Management of this company has proven itself to share its Net Cash with shareholders the past 10 years through generous dividend yield. 

5. The stock is available for sale during the corrective wave, i.e. it is not exactly chasing and buying on a breakout, but on pullbacks.  There's some fears about declining revenues in the current year, as it's quite a sizeable drop for FYE2023 vs FYE2022.  The drop may not be over yet.  The question is - is this drop permanent, or do you trust Management to solve this temporary problem over the next 5-10 years?  Price looks fair to me for an above average quality business.  

6. There's potential for a price gains in the future.  It's NTA is currently 2.10, where 2/3rds is Net Cash.  It could consider a special dividend one day (a nice bumper gain) and this will also improve its capital efficiency, giving even greater returns to shareholders.

Major Shareholders

Interestingly, the only major shareholder is Wistron owning 26%.  The rest are minorities.  Top 30 only owned 58%.  Feels a bit too low, not quite understand why this would be the case ... (perhaps it due to its ageing Group MD and management?).


Target Position Sizing

At the right price, this stock may deserve an over-weighted position.  If my neutral position size is 3% capital (roughly equivalent to 33 long term investing position), then, this stock deserves at least 4% or more (but see below for what I don't like about this stock too).  The business fundamentals the past 10 years is good, the management is good (trustworthy enough to share their profits fairly with shareholders, maybe can do a bit more), the chart pattern is good (for long term investors), this one can buy during dips to get to a full size position.

What I don't like about this stock?

Every stock has risks, and sometimes, it's good to play devil's advocate to a stock that you like.

Here are some reasons why I don't think it's wise to own too large a position.  If neutral position is 3% of one's portfolio, then, too large a position could be say doubling or 6%.

1. The drop in revenues in FYE2023 vs FYE2022 is quite large.  The EPS in 2023 is supported by one-time gains.  Next year FYE2024 could show a sizeable shrinking in EPS.  Hence, I think 25 sen is a good estimate of its long term EPS, notwitstanding it earned much higher from 37-46 sen the past 3 years.  At 25 sen, it is still cheap.  However, there's always risk that its future revenue might never make all time high over the next 2-3 years again i.e. it could be a long wait.   However, its dividend yield is attractive, but if EPS is too low, future dividends might be cut.  Nothing is guaranteed.

2. Related to 1, the business can be regarded as niche, dealing with speaker systems, acoustic products.  It's client base is smaller and niche so, there's a higher business/revenue risk than say MAYBANK, due to smaller potential customer base and competition.  Whilst it should beat MAYBANK returns over next 5-10 years, it pays to be cautious.  Both are good in their own ways.

3. The Group MD, responsible for past success, is a 68 year old Taiwanese who was appointed in 1989... has the alarm bell rung yet?  Who will be its successor? Given the large decline in 2023 revenues, does this ageing Group MD still possess the necessary drive to turnaround FYE2023 declining revenue?  

4. The stock market cap is only RM800 million - looks like a small cap to me.  Small caps are volatile - they can give big wins but they are also riskier and has higher chances of dropping a lot.  Hence, not more than 5% of one's portfolio.  

5. There's no rule that says that Management can't continue to hoard its Net Cash in the future, especially if the Group MD is getting older.  All else equal, older management are typically more conservative.

6. Charts are fickle.  Odds are never certain.

7. Over next 10 years, it's almost a certainty that KLSE will face a market crash.  Odds are high.  In the event of a crash, this stock will crash more than say MAYBANK.  

8. The stock is not well covered by analyst.  According to i3, there's no coverage.  This is both good and bad.  The good thing is if one day it gets coverage, the stock is likely to run.  If not, we continue to collect its nice dividend yield, well supported by its net cash.

9. Can't find its capital commitments in the last quarterly report.  This can raise eyebrows, because R&D seems essential over the long term for future growth, and not too clear from the Quarterly Report on how much it is investing for its future growth over the next 5-10 years.

Hence, for long term wealth accumulation, never be greedy.  Overweight from neutral at the right price, say 3.5% to 4%, and that is probably good enough.  If there's no opportunity to further add, that's fine too

Investing Strategy & Timing

Overall, I still feel positive about this stock.

Price action feels favorable overall.  Since Sep 2021 peak, it has clearly entered a corrective wave phase.  Today is March 2024 i.e. it has been consolidating for 2.5 years.   Normally, this feels like we are getting close to the bottom, before the next impulse wave up that could last for several years.  Nothing is guaranteed of course, but a chart reader plays the odds.

Additionally, I feel the odds of pullback and retesting is more than 50/50.  Hence, over the next few months / 1-2 years, we will get a chance to buy cheaper than RM3.13.   My immediate target is around 2.85.  

I currently own this stock.  At 3.13, it is 3.1% of my portfolio, so, I am already slightly overweighted relative to neutral.  My average buy price is RM2.63.  I first entered on 3 May at RM2.69, continue to buy on the way down at RM2.32 but didn't buy enough, then, buy more on the way up as high as RM2.87 to get to near 3% capital.  

And this is good enough to give me a paper gain that is larger than my biggest short term swing trading win.  (I trade using a smaller position size, than my long term investing position).

Summary and Conclusion

Some ideas jumped out at you, and this one certainly did a few months ago.

We can never get our entry timing precisely right and we don't need to. 
Whilst hindsight is 20/20 and it's easy to feel like I should have loaded up when price fell to 2.32, but this kind of thinking is wrong thinking because nobody knows the future.   
Additionally, it's actually not a bad idea, if one's position is not yet full, to be able to buy when price went back up.
I pat myself at the back for forcing myself to get to a full neutral position at least with this stock, even if it means chasing up to 2.87.  This is because at 2.87, the valuation is still compelling.   That was in early January 2024.

Nevertheless, after nearly 3 months of watching its price action, I suspect over the next few months/ 1 to 2 years, there is good chance to see 2.85, when I plan to load up a little bit more to perhaps up to 3.5% to 4% (depending).  It's certainly on my watch list.  If it falls below 2.85, that's okay too in the short term, as my game plan is over a much longer time-frame.

Over the next 5-10 years, the odds of making a new high looks better than 50/50 from chart perspective (even if the Group MD is now 68 years old).  And the dividend yield is nice 6% or higher per annum and growing.  And net Cash growing too.  

Hence, decent odds to beat EPF's 5.5% to 6% per annum returns over next 10 years.  It's worth a solid position in one's investing portfolio, slightly larger than 3% neutral position IMHO.

As usual, never get greedy, no matter how attractive a stock is.  Every stock has risks. 

And never be stubborn.  Eventually, price action will reveal itself, and when it does something different that what is expected, be mindful to review and reconsider our initial thesis.

Sunday, March 24, 2024

Should you Average Down or not?

I first heard of the concept of "Averaging Down" over 3 decades ago.

It started off with positive intention from its cousin "DCA" or "Dollar Cost Averaging".  Instead of investing say RM120,000 at one go, you should consider buying RM10,000 per month over 12 months instead.  If market goes up and goes down and by the end of the 12 months ended up exactly the same price, you'll end up owning more shares, than if you had bought it all at one go at inception.

Dollar Cost Averaging (DCA)

Here's an illustration of DCA.  Imagine you have RM120,000 to invest when Price is RM1.  If you buy at one go, you'll have 120,000 shares.

Now, consider the alternative method - break the RM120,000 into 12 equal parts and invest each month.  Price goes up and down during the next 12 months and if price gets back to the same RM1, you'll end up owning more shares due to the price volatility.  In this illustration, when price went up, then, come down, and then recover back to RM1, you'll own more shares at 124,049 shares, instead of 120,000 shares.

So, why does DCA work in flat markets?   
Simply put, it forces you to buy more shares when price is low, and forces you to buy fewer shares when price are high.  
As a result, 12 months later, you own more shares with the same outlay.

So, summary pros and cons of DCA.

Pros - Works great in 2 kinds of markets:
  1. Flat markets and
  2. Markets that declines temporarily and 100% sure to recover back (nobody knows the future though).  
Cons - 3 important disadvantages:
  1. Not so good in rising markets (you'll end up owning less shares in a rising market)
  2. You'll lose much bigger in $ terms if it goes down and stays lower than your entry price forever
  3. The worst of it is when it goes down to zero (then, you'll lose everything).
Averaging Down (AD)

So, what's the difference between "Averaging Down" and "DCA"?
The difference is when prices are higher - you don't buy.  You only buy when prices are lower.
So, this has pros and cons too.

Market Type 1 - Volatile flat market - a market that goes up/down and eventually comes back to original price. 
  1. In this type of market, Averaging down has pros and cons relative to DCA. 
  2. If you believe Position Size determines your final returns more than Entry Price, then, DCA  typically gets you to full Position Size than AD, because in DCA, after "n" month, you'll end up with full Position Size regardless of whether market goes up or goes down.  Whereas AD might only get you a tiny position if after the initial move down to give you 1/12th the position, price then went up higher than stayed higher.  
  3. However, if you can get in full position with both methods, the difference is likely to small in the long run after 100 stocks.  In practice, you're unlikely to get a full position with Averaging Down in all 100 stocks.
Market Type 2 - Rising market - the market price keeps rising to be higher than original entry price
  1. In this type of market, DCA is superior to AD because it keeps adding more shares on the way up to full position size, to give you a bigger $ win, whereas under AD, you only have 1/12th at entry and then, that's all you have.
  2. In a generally rising market (and if you have 100 of such markets), DCA is clearly superior than AD simply due to differences in position size.
Market Type 3 - Declining market - after entry, price keeps getting lower and lower
  1. In this type of market, if the total outlay is the same, then, both are similar and the same.
  2. Over 12 months, you keep buying more at lower prices and eventually, you'll own a full position.
  3. If price goes to zero, in both cases, you lose everything whether DCA or AD!
In conclusion, which is better?  DCA or AD?

According to Buffet teachings on stock selection, neither is better.

What is more important is it's future price action.

If the stock's business economics is of superior quality (e.g. it is in a superior type of business, a monopoly, have an economic moat, etc.), is run by able, honest and trustworthy management, and is available at an attractive price (where future price will be higher), then, it's future price action is likely to be rising.   Then, your risk here is not getting a full position.  You don't want to be owning only 1/12th of a full position - here, DCA is superior than AD, but an immediate buy at full position is superior than DCA, if you have picked the correct stock at the right price.   However, if you have 1-2 months to accumulate, then, odds are usually some form of averaging typically gets you a little bit more shares but in the long run, they don't make much difference, compared to finding that superior stock.

In short, future price action is key.   You want to find a rising market, where the price action is likely to be rising, where "a rising tide raises all boats".

And if its future price action is downtrending, and possibly heading down to zero, then, avoid at all cost.  
  • Don't even bother to own a piece.  
  • Ignore, disregard and move on to other markets.   
  • There are thousands of stock with markets to trade.  Get in them.  
  • Don't be stubborn.  Let go of your losses and move on to find new markets where future price prospects are likely to be rising.   
  • Invest there, so that your portfolio keeps making new all time highs!


Saturday, March 23, 2024

CARLSBG Update

 Previous article on CARLSBG here.

Annual Report Update

CARLSBG published its annual report on 22 March, and reading this over the weekend, I see no major surprises to my long term assessment of this business.  To me, the quality of the business remains decent, above average, I can rely on this to deliver at least 8-9% per annum long term returns, and is worth a neutral position size (3% portfolio or more).   This remains a business where the lower the price, the more I accumulate up to neutral position at the bottom.

Chart Update


The long term chart is self-explanatory:
1. After the long bull run from 2009-2019, we are now in corrective wave phase.   
2. My guess it if last time took at least 10 years to correct and find bottom, this time will be different.  
3. There is the 61.8% Fibonacci retracement, confluence with previous high and previous lows, suggesting the major bottom to be around RM17.   For this long term chart, that could take a while (months, maybe even longer). 

10 Year Business Updates
 
Self explanatory:
1. 10 year EPS CAGR growth is 5.2% per annum - that's decent, and rates a B.
2. 10 year DPS CAGR growth is 3.0% per annum - that's decent and rates a C+.
3. 10 year NAPS CAGR shrink 3.4% per annum - not quite sure why, but that rates a C-.
4. 10 year RPS CAGR still growing 3.6% per annum - that's slightly higher than inflation rate and rates a C+.
5. Latest dividend yield = 5% (93 sen / 18.5 say) - that's high, and since it's sustainable, rates a B+.  For a dividend investor, combining long term dividend growth with long term business growth, that has very high odds of beating EPF.

Future Price Required, to earn 9% per annum total returns

My long term investment objective is modest - as you know, I aim to beat EPF long term 6% per annum returns.  My personal target is 9% per annum.  The question is how do we know if CARLSBG can deliver 9% total returns per annum over the next 10 years?

The truth is we don't know.  Noone knows the future.  All we know is to align ourselves with probabilities.  

One way for long term investors is to ask this simple question.  If long term dividends give me 5% per annum, what kind of future prices do I need to see, before it delivers 4.5% per annum long term (to give 0.5% buffer)?

My Future Price Required Calculator shows what kind of prices I need to see, in 1, 2, 3, 4, 5 and 10 years time, if I were to sell after commissions.  

It's not a very high ask.  To get 9% total returns per annum over next 5 years, CARLSBG needs to get back up to RM23.3, which is not even the peak of the corrective wave (B).   Over the next 10 years, CARGLSBG needs to get back to RM29.1, well below it's all time high of RM39.

In short, over the next 5-10 years, I think majority odds, that CARLSBG will deliver 9% per annum, if enter at RM18.54.   If you enter at a lower price, the odds increases substantially.

This is not a short term strategy - it's at least a 5-10 year strategy for long term wealth accumulation.

Target Position Sizing

Previously, I shared that my position size is around 2.4% portfolio.   Today, it has shrunk to 2.2% portfolio (excluding past CARLSBG cash dividends received), as my portfolio has grown (from other gains and also CARLSBG past dividends received), and CARLSBG price has shrunk.

My target remains around 3% when CARLSBG gets into my accumulation zone where I think the bottom is around RM17 which can take several months, or even 1-2 years to get there.   Meanwhile, I'll continue to collect the 5% per annum dividends.

Another reason to limit at 3% at the bottom is because I also own HEIM.   Similar target position sizing.

Conclusion
 
For long term wealth accumulation, the investment strategy is simple and easy to follow for someone who wants to spend his life doing other things than investing or trading.  As Buffett says, the key is to "start early".
  
1. Accumulate quality businesses at fair/lower prices.  
2. Have a clear strategy on when to enter and eventually, when to exit.
3. Position size appropriately.  Never bet everything on a single business.  Ideally, diversify at least 30-50 different businesses when the opportunity arises and we are able to accumulate at the right price.
4. Once we secure them, forget about this stock when after it finds the bottom.   
5. Be patient.  It is good to collect 5% per annum dividends every year.   Doesn't quite beat EPF, but close.
6. For CARLSBG, the strategy to beat EPF even though dividend yield is smaller, is the additional price gains.   If previous bull run took 10 years, be very patient and do nothing during the bull run and just wait it out.
7. Eventually, the Price gain in 5-10 years time will deliver total returns exceeding 9% per annum, here, likely by quite a distance if it makes new high (which over next 10 years, has at least a coin toss odds of 50/50).  A doubling of price gains over 10 years is 7% per annum, giving total returns of 12% per annum.  If it gets there in less than 10 years, the CAGR is even higher than 12% per annum.  This is very very good for the long term investor.

This stock is not suitable for the impatient short term trader looking to earn 10%, 20%, 30%, 50% or 100% returns over months (and after 100 trades, see his account dropped or doesn't beat EPF).  CARLSBG is a boring stock.  Precisely because it is boring, and precisely because there is good management team to manage this business to provide returns to shareholders, that you want to have some of your net worth to partially own this business.  Let the professional management team grow your wealth.   

Sunday, March 3, 2024

BAT Declining EPS/DPS - How much is the stock worth?

Intrinsic Value / Valuation is tricky.  There are many different ways to value a business.  Buffet and Graham's method is to have an adequate Margin of Safety.  In other words, we want to be prudent, by giving ourselves an ample Margin of Safety so that even when we are wrong, we still make monies.

I've blogged about BAT before here.  

BAT recently published its quarterly report and closed the year.  To keep it simple, FYE2023 EPS and DPS is 68.2 sen and 63 sen respectively.  8 years prior, BAT EPS and DPS was 318.7 sen and 312 sen.   This means that the EPS and DPS CAGR over the past 8 years are -17.5% and -18.1% per annum respectively.   

Let that sink for a minute.

Every year over the past 8 years, BAT EPS and DPS shrunk around 17%-18% per annum consistently.

BAT current price is RM8.2.  

  • With EPS of 68 sen, its P/E is 12 times
  • With DPS of 63 sen, its P/DPS is 13 times.
The question is - is the business worth 12 times current earnings (or 13 times current dividend)?
It really depends on future EPS and DPS growth rates.

This is where it gets tricky - everyone will have different views about the future growth rates.
Will it continue to shrink?
Will it stop and turn around?
Does anyone knows the future?

This is where Buffet and Graham's brilliance lies.
When nobody knows the future, they want ample Margin of Safety.
In other words, make conservative assumptions, calculate the Intrinsic Value, and wait for Price to fall below Intrinsic Value at a margin and then, only trigger the buy.

So, what conservative assumptions should we make?

I offer you 3 scenarios, to understand the mathematics of Intrinsic Value.

Scenario 1 - Aggressive - assume no shrinkage, no reduction, i.e. assume EPS and DPS has found the bottom.  In my opinion, this is a very aggressive assumption over the next 10-20 years.   

Scenario 2 - Ambitiously realistic? - assume the rate of shrinkage reduces by 2% per annum, i.e. eventually earnings is flat forever.  This gives credit to current Management who tries to reduce the shrinkage in earnings and dividends.

Scenario 3 - Prudent - assume rate of shrinkage reduces by 2% per annum from -16% down to -6% and earnings shrink at -6% per annum flat thereafter.

What does the results look like?


I project the EPS for only 20 years for prudence.
My discounting rate is 8%.  Why 8%?  Because I can safely invest and earn 8% p.a.  This is my required rate of return.  

So, how much is BAT's Intrinsic value worth under 3 different scenarios?

In Scenario 1, if BAT's earnings remain flat at 68.2 sen forever, then, the stock is only worth RM6.70 to me.

In Scenario 2, if earnings initially shrink by 16% but improves over the years and eventually stays flat, then, it could be worth RM4.00.

In Scenario 3, if earnings keep shrinking at an ultimate rate of -6%, then, it could be worth RM3.60.

Sanity check.  BAT Net Tangible Asset (NTA) is RM1.32.

Summary and Conclusion

BAT's price has crashed substantially the past decade.
It's peak price is near RM75.  Today it's only RM8.2.  Is this a cheap stock?

Unfortunately for BAT business, its EPS and DPS continues to shrink the past 8 years.
It's business appears to be sun-setting.  
It's revenue continues to shrink.
It's hard to imagine for hard core smokers but there are less customers smoking BAT's products.
Instead, it's being persistently replaced with alternatives.
And these alternatives doesn't bring in the same level of profit margins and revenues like it did before.

The huge question mark is how long will it take the business to settle.
Nobody knows the answer to that question.
Because of that huge uncertainty, that's where Buffet's and Graham's brilliance comes in.
They insist on having an ample Margin of Safety in the valuations.

3 out of an infinite scenarios are offered here for prudence.
They indicate that the fair value is probably around RM3.50 to RM4.00 based on today's Intrinsic value.
Which means RM8.2 is still not cheap.

Final thoughts

Noone knows the future.
As retail investors ("bilis"), we can't afford to under-perform EPF returns.
EPF gives us 5.5% to 6.0% per annum long term returns for "doing nothing".
If we want to invest in stocks ourselves (instead of parking in EPF), then, we demand at least 9% per annum returns (or at the bare minimum, 7%-8% per annum returns if we DIY).

We don't lose any monies if we don't invest.  
We make 5.5%-6.0% per annum long term if we park in EPF.
My illustration above showed that to earn 8% p.a. returns in a declining EPS/DPS scenario, the stock needs to be trading at around RM3.60-RM4, before I start to be interested.  
In fact, I probably need another Margin of Safety, of possibly 30% buffer.  
This suggests, I could probably trigger a long term buy at around RM2.50-RM3.

In short, RM8.20 is still too rich for me.
To each, his own.

LCTITAN - Quarterly Update

My previous article here .  Last week, LCTITAN announced its quarterly result.  We saw 8 consecutive quarters of losses totalling 108 sen.  ...