Why do we care?
Historically, when US markets sneeze, we catch a cold.
Global stock markets are so interconnected these days. US stock market remains the largest in the world, everyone still looks at it, including Malaysians.
The US stock market has been in a long term bull run since the low of the Global Financial Crisis (666.79 in Mar 2009), it's more than 15 years of bull run now, the question is when is the next one coming?
If Tech Crash and GFC repeats, we could be in for a reasonable winter lasting over 1-3 years potentially, if history is a guide, even if notoriously unpredictable.
What are the Predictors of US stock market crash?
Firstly, nobody can successfully predict a stock market crash consistently all the time. There are some general principles, but translating that to accurate timing / peak levels is extremely difficult. Some considerations:
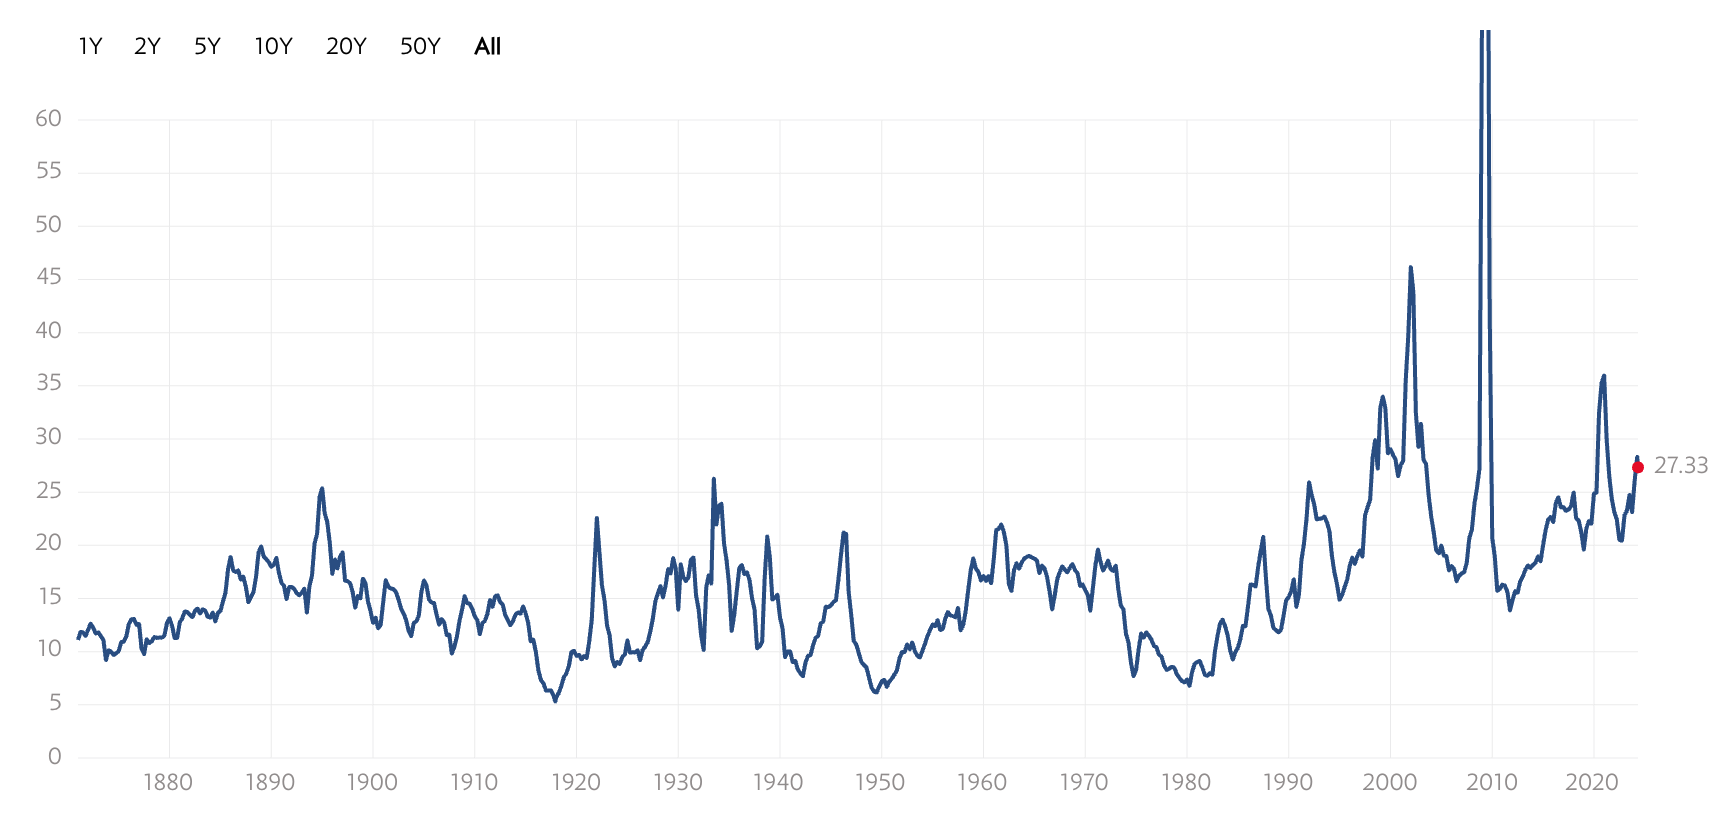
1. Over-valuations.
The trouble with this is that market peaks at different P/E levels historically, so, there's no one single magic level. Here's some ideas:
See the peaks? Since 2000, the peaks have gone much higher than prior peaks. That's one difficulty. Second difficulty is that peaks normally occur when EPS is depressed and at its lowest i.e. predictors of market bottom rather than peaks. Somewhere in between is when markets - which looks ahead - peak first before the economic recession/difficulties comes in to depress earnings. Not so easy.
So, where's the US market right now?
Looks to me, it's not near peak yet? E.g. compare to Covid peak in Q4/20 when it hits 30. Recall around this time, Malaysia and other countries have been in global lock-down for quite a while, economic activities hit hard, earnings at the lowest and not surprised that P/E peaked. But prices have already came down hard, a bit too late isn't it?
EPS lowest in Q1/2020, when lockdown first started. However, note today's EPS is so much higher than in 2019 before COVID. So, US earnings is still resilient. Note Fed funds peaked for over a year already. The Feds are doing a good job so far, balancing interest rates with economic activity. We now have the longest ever period of an inverse yield curve, and we still haven't seen earnings taking a significant dive.
2. Economic indicators?
Which one?
Can you act on it timely enough, or too late?
Where is the threshold level?
How do you interpret this?
Let's start with US GDP growth.
FYE2023 looks normal at 2.5%.
But most recent April figure is 1.6%.
Where is the threshold level to be concerned and start selling? (I don't know).
Honestly, I can't really use it timely. I can't use this to accurately predict historical market crashes in advance before everyone else. By the time I see it, 99.99% of the time, I'm quite certain market prices have already moved. In short, this is lagging for me.
The wierd thing is last time during 2009, there's that negative bar and the stock market after 2009 has only been wonderful. In COVID 2000 negative bar, we've only see 3 positive bar so far, so, a valid question is why can't this market keep running over next few years? I really don't know.
Let's try another one - US unemployment rates.
This chart is not telling me anything new. All I see is the Covid spike i.e. when most countries are on lock down, unemployment went up to very high levels and today's level doesn't quite bat an eyelid. Hard to get excited by recent figures isn't it? What would you do? Buy more or sell more? I don't know.
Let's try another one - US inflation.
Past 10 years. The right bar doesn't look like it's at an extreme level? How do you interpret this? When inflation peaked, markets didn't crash. When it bottomed in 2020, that we already know due to Covid and high unemployment, low GDP activity i.e. hard for inflation to happen when there's so little monies circulating around notwitstanding lower economic activity. A lot of these type of analysis sounds sophisticated, but how to use it to make money? I don't know how. (Hence, I usually end up ignoring a lot of these indicators, because it never helped me to make money).
3. Inverse yield curve
Historically, this one is perhaps one of the more reliable indicators in the sense that when it happened and when it is prolonged, it appears to foretell stock market crash.
Why? Well, look at it. Inverse means short term yields are higher than long term yields, the opposite of what normally happens. In normal times, market requires higher yields at longer duration, to be rewarded sufficiently for higher uncertainty. So, when it's inverted, it means market demands higher interest rate over the near term because it's expecting even greater uncertainty short term and needs to be rewarded for the higher uncertainty short term. What is uncertain short term? Lower economic activity short term? Stock market crash?
Certainly, higher short term interest rates doesn't help businesses. They have to pay higher interest costs, depressing their profits. This can trigger recession if prolonged.
Certainly, banks will find it difficult to raise funds. They have to borrow long (lower yields) to lend short (higher rates) which increases their risks. This can depress their stock prices when banks takes higher long term risks.
So, you have this situation that is precarious - nobody likes it.
So, you might be thinking - the longer this happens, the higher the chance of recession?
And the market has been on the longest every inverse yield curve today since 1980s.
But when everyone expects it, will market crash?
Are they "just waiting" for the herd to run out of the gates?
It's too obvious, yet, there seems to be some fundamentals behind this.
Can markets defy fundamentals forever?
Markets always eventually crash. The only questions are when and how big?
This one plus all others does signal caution. For retirees especially without an active income and relies on savings, you cannot afford to be aggressive now.
But there's no law that says that this inversion cannot last for a few more years, or last for another month. Anything can still happen.
4. The Feds - Interest Rate and Monetary Policy
I recalled reading that the official Fed position is that they expect 3 rate cuts this year, but so far, nothing yet. Why rate cut? Well, they need to do something with the huge debt in the US balance sheet. The world holds their bonds, they can't keep paying high rates externally. The only fear is spurring further economic activity. An economy that is too strong also has problems. So, market takes a dip in anticipation of the upcoming Fed meeting, but as usual, the uncertainty spikes up before Fed meetings and then normalize. Longer term, it's 50/50. If rates are cut, the bears will say that this is proof that Fed sees recession coming and so need to spike up the economic activity via lower interest rates. Bulls will say this is proof that the Fed acts in advance and will continue to manage the economy well i.e. the crash is pushed back further and further into the future. It's all interpretations and herd behaviour i.e. I really don't know how to use this to predict future market movement.
Chart wise, yes it dips after hitting that strong Fibonacci resistance, but that's expected. But will it predict a crash coming next? I don't know. But I have a plan if it comes and a plan if it doesn't come.
5. Geopolitical risks?
Recently, the Israel-Iran drone attacks seem to cause some worries of escallation that might speak contagion. The Israel Hamaz Gaza related conflicts. etc.
But taking a contrarian position, aren't these conflicts happening all the time?
Also, remember 911? When markets crashed, aren't those the best time to buy and then sell when the conflict is no longer a conflict?
To me, that's a noise.
So, what characterize a market crash?
For me, it has to be price levels. Price Charts. A significantly lower prices over a prolonged period.
And that must be an opportunity.
How to capitalize a market crash?
This is when good quality businesses run by able management is sold at an attractive price. As Buffet says, this is the time when he feels he is the only guy in a harem full of beautiful women. He doesn't know which one to choose. Everything feels attractive.
Nevertheless, not all businesses are the same. Some gets hit harder and that's when they become more attractive if they have stronger recovery power. During crash, dividend yields rise but what you are after is the subsequent price gains. Your mindset need to shift a little.
The market values of your existing stock holdings will reduce. However, you are diversified and you own good quality businesses. So, the fall is normal and no need to panic. Their dividend yields will rise and comfort yourself that your income is still there, maybe dropped a bit but future price gains is even more attractive.
As market values of stocks reduce, they will become a smaller proportion of your Net Worth, as your EPF, your FD, your property values are fixed and immune to the fall. If they are previously 33% and market values fall 10%, they reduce to 30%.
In the first 6-12 months after seeing the peak in the market, typically around this time, this is when you start to consider buying the bargains, to raise it back to 33% i.e. rebalancing. A lot of people will start shouting cheap, but ignore them. It means real fear hasn't happened yet.
However, near the bottom (typically longer than 12 months of depressed prices), it's time to increase that 33% to a higher %. By this stage the voice that shouts bargains have dropped. That's when real fear comes in.
Volatility will be extremely high - typically highest. VIX will typically spike up. That's the time to start adding the 33% to be a higher number like 40%.
Volatility is so high, typically, you will miss the timing because it's so damn volatile.
There is no guarantee of recovery, but eventually recovery will happen in years to come. It's not tomorrow, it's not next week, next month or even next year. To get the biggest bang for the buck, we are talking several years.
Meanwhile the advantage of buying high dividend yield stocks is that the dividend income can sustain you and likely to be more than what you'll need. The lows will give you a chance to own many more shares.
And many years later, the price gains will come if you have holding power and can hold for many years after. Good quality businesses will recover, when market normalize later, even if very hard to see then. This is when you will probably look at increasing your dividend income by another 5% --> 15% --> 25% ---> 50% -->100% depending on how bad the crash is and how well you play this crash. This is also when you will have days and nights when you cannot sleep due to the massive volatility. This is when you feel suddenly very rich after recovery, only to experience very huge falls causing you to feel regret, and when you least expect, the recovery makes you feel very rich again. All this if you keep watching the stock prices too closely. The fabled "emotional roller-coaster". Not helpful.
Instead, as dividend investors, anchor ourselves in the dividend income. Keep adding that dividend income. Only after you are sure you've seen bottom, shift some of the dividend income into price gains. The price gains will be spectacular. Keep a lookout at warrant prices but unlikely you will be able to take advantage of that as typically, the issuers are also on the same lookout and looking to make a killing too.
All these are just speculations. Some based on prior experiences of several market crashes but every crash is different. It never turns out the way you expect it. I was too young to remember the Oct 1987 stock market crash but old enough to read it in the newspapers and see its effects. I remembered the Tech Crash and was lucky enough to participate in the recovery but my portfolio was far too small to make a difference to my life. Every crash after that was different. The last one was Covid where I missed the opportunity due to life and work issues, so, just because you know doesn't mean you are able to catch it.
Being ready for it mentally and having the financial resources ready for a crash is not easy. Group think rarely helps. Critical to think and act independently and quietly.
It's easy to write this when markets are near all time high in the US.
Will Malaysia stock market crash when US crashes?
Even though the opening statements said that when US sneeze, we catch a cold, that statement is not entirely factual nor always true. There are periods of convergence and divergence.
In short, nobody knows in advance, everyone knows in arrears.
Summary and Conclusion
Has S&P500 peaked yet?
Short answer is not sure - maybe it's at its last quarter of its long bull run of many years since GFC, but hard to say more precisely than that. The inverted yield curve can't last forever, and everyone is looking out closely too, so, maybe it can last longer this time?
Will a US market crash cause KLSE to crash?
Short answer is that whilst there is more convergence than divergence, historical data suggests that because the US market is so large, it typically has an impact across the world including Malaysia, although the extent may not be that large in Malaysia (e.g. Tech Crash was bad in the US, not so bad in Malaysia). But it's not full-proof and I won't be surprised with either outcome.
We can't avoid significant falls in market values if US S&P500 crashes. KLSE will follow, maybe lesser extent. Your diversified dividend stocks should also fall, maybe lesser extent. Diversification does not immunize your portfolio because > 50% of the price driver comes from market falls. Expect FD rates to rise and expect EPF returns to fall if EPF didn't manage well.
Your EPF and FD proportion will rise as a % of your Net Worth, as your stock % falls. During bull markets, it's the reverse. So, when the reverse happens, this is the time for very careful monitoring and execution of averaging down and increasing the % in stocks. Nothing extreme, because you still have to live but despite the huge volatility (VIX all time highs perhaps) and extreme fears and extreme aversion to stocks, when people stops calling buy the dips or buy the fears, that's when you should be looking out. The first few calls to buy the dips should likely be ignored.
Anchor on the dividend income. Those will likely dip a little too, so, look to add to keep it stable initially when it's significantly cheaper. No absolute criteria. Everything is relative and dynamic at the time. Experience and sense matters. Seek calmness and quiteness when everyone around you are panicking. No blind averaging down, you will easily spend too much cash buying. You won't catch the bottom in any significant manner. It is okay to leave the buys on the way up. Cash is King during this period. Bear markets don't last very long, maybe 3 years at the most. Vast majority of people runs out of cash, and vast majority of people will be too afraid to utilize the little cash they have left.
Most of your dividend stocks are intended for rising dividend income over the long term (> 10 years). Anchor on the business and the future dividend income. Price gains may be the largest but ultimately, they are still bonus. You actually don't need to do anything. Hence, any price gains actions are bonuses.
Be prepared, good luck when it comes one day (if you can still remember this article)!


No comments:
Post a Comment