Thursday, April 25, 2024

TENAGA

A bit of trivia.  Fundamentally, TENAGA needs no introduction.  It's not the best fundamental business out there, but it's definitely above average due to its pricing power, even if not managed by the best quality management.


Started buying TENAGA on 28 Apr 2021, nearly 3 years ago.

  • Added 3 more times as indicated by the upward pointing triangles.
  • Then near resistance, sold a small amount.  Still retain 85% of purchase.

With this kind of price action and trades, as of 25 April 2024:

1. Total Returns = 15.18% per annum CAGR (Price + Dividends).

2. Total Price Returns (exclude Dividends) = 10.65% per annum CAGR

3. This suggests that the Dividend Returns = 15.18% - 10.65% = 4.53% per annum CAGR.

The Dividend Returns are solid - lower than EPF long term returns of 6% per annum, but still higher than FD long term returns of say 3% per annum.

But ... Price returns are even better - more than doubled the Dividend Returns.
That helps Total Returns a lot - especially the 2 buys near the bottom.  That's like tripling the dividend returns!

Moral of the story:

1. Invest, don't trade. (TENAGA charts are not that suited for trading)

2. Invest in above average quality dividend stocks for wealth accumulation.

3. Invest more when the price of this above average quality business is sold at an attractive price.  At the time, the dividend yield when I entered in my 3rd and 4th purchase was around 5.5% to 6% iirc.  

4. Position size is critical.  If neutral position size is 3% and you feel the price might go lower but not too sure, invest a portion of the 3% first.  The advantage is that when your price sense turns out correct, add more when price is lower.  You can do this without violating your position size rules.   

5. However, I didn't get a full 3% position on my last purchase.   I didn't look harder and didn't ask myself timely enough whether I've seen the bottom in TENAGA when price went above my first entry or prior.  On the uptrend, I should at least get a bit more to get to 3% full position size around July 2023.  (too busy with work).

6. Sold a small portion near the horizontal resistance, but price continues to break above that, so, this looks like good odds of an uptrend.   The best thing to do in an uptrend is to sit tight and do nothing.

7. Quick 1 second visual look - next resistance is probably near RM13 (weaker) and RM14 (stronger).  As these are longer term charts, there's no need to watch prices everyday.   Don't need to be precise, but glance once in a while.

Why sell a little bit?  

Things are not black and white.  Probably lowers total return for a long period (because cash drags), but important to have some cash because one day, markets are guaranteed to crash if one has a 5-10 year horizon.  When this happens, you will be glad to have cash.  And you have no idea on when this will happen.


Friday, April 5, 2024

CHINWEL

I think it's entering Accumulation Zone.  Position sizing is critical now.

Long Term Charts

The 61.8% Fibonacci level near 1.18 is a logical first entry.
There's a couple of downtrend line support below around 1.10 down to 1.00.
There's the 78.6% Fibonacci level near 0.96.
The patient long term investor will stalk his prey over the coming months.

Business Profile
Simply put, its 2 main divisions are fasteners and wires.  Historically, it's cash cow has been the fasteners products (wires lesser extent) but in recent times faces huge headwinds in both segments, which is why the stock price has taken a hit.  It also has a massive net cash, built up from windfall gains in recent years.  This is simply due to the cyclical nature of its business - some years faces tough times, other years huge windfall gains.  The most recent gain was spectacular, causing the company to turn from a company with sizeable debts for a decade, into a huge net cash in just 1 year.  The company was prudent - it paid off its borrowings, and also bought a subsidiary withfreehold land worth over RM62 million.  The land doesn't pay interest though, and probably won't be disposed, but it's worth something and not nil.

See image below - during 2022, it acquired a subsidiary with 62m worth of freehold land. Land by nature doesn't earn anything. 

Turning Point to huge Net Cash - 2022

Compare FYE2022 vs FYE2021.

The turning point is huge PBT 122m (2022) vs 32 (2021) or 90 million difference.

Also good receivable and good inventory management vs prior year further increases its cash.  Responsibly does the opposite with payables.  Good management during very good times (it's easy to be good management when one is flooded with cash).

Sometimes, I wonder if it's too good to be true ... (here, we have to trust the external auditors).


Huge Net Cash Today, but wasn't like this all the time

Today, Net Cash + Land = RM288 million, or RM0.96.

Two years prior, Net Cash = RM0.3 million.  (Was 2022 too good to be true? No reason to doubt yet from price charts)

There's no magic to this huge growth - they had a windfall year back in 2022 and in the last year faced huge headwinds.

Near Term Future Prospects Bleak causing short term analysts to miss the picture

That's one view.
I do hear other views questioning if the analysts actions - originally started with HOLD - and then briefly turned to BUY - followed by recent SELL - the question is isn't this type of action intended to shake off the weak holders?   
Regardless, we use these to our advantage.

Analysts Short Term Business Analysis is not wrong


I agree that short term, the key fastener segment sales volume looks subdued short term.  Earnings for Wires look bleak too and they are waiting for government contracts.  Overseas particularly from Europe is challenging, due to the conflicts there.  North America is holding.
Just look at last 3 months vs prior year and just see how volatile its business is.  2022 was bumper harvest year, 2023 is lean and will probably get leaner before it gets better again.

Here's another comparison past 6 months 2023 vs 2022.  The recent revenue fall is very real.  But this is what cyclical stocks mean.


Where is the source of optimism for the long term?

The business financials have clearly fallen hugely - big huge drops in revenues, segment profitability has turned from large positives to almost nil.  Why can't earnings turn negative in the coming months?  Why can't there be more pain?

The truth is nobody knows.  Odds are, it's probably not bottom yet.

Founder and Substantial Shareholder Actions

If you own this stock for the long term, you must know this guy - Mr Tsai Yung Chuan.  He's the founder since 1989.  His wife and his 3 children are directors and senior management.

He's not a very good market timer - some of his past acquisitions are at high prices.  However, his most recent buy at end Feb 2024 at 1.19-1.20 is close to price chart - the 61.8% Fibonacci level at 1.18.  The size is decent around 300k+ shares - a tiny amount for him, but still, not that small.  But he did buy bigger back in Feb 2022 at 1.56 before it shoots up to 2.00 but what he couldn't predict is that hardship that followed after a very good 2022 year.  Nobody has a crystal ball on what's going to happen in Europe, not even him.

Past 10 Years Fundamentals

The 10 year CAGR is not inspiring, but that's expected for a cylical business.
The NAPS grows 6% p.a. compounding and comparable to EPF, so, that's decent say B-
EPS and DPS depends on start year but the key is to note the huge 2022 EPS which was that bumper year that's unlikely to be repeated soon.  But if you have a 10 year time frame in this stock, then, it's very good odds to see a repeat over next 10 years.  Still, Buffet would prefer something better quality than this type of company, but if you time your purchase and sales, it could turn out to be similarly rewarding / better.

Trade Strategy and Position Sizing
We don't own cyclicals for its Long term Dividend Yield - that's self defeating, because cyclicals will have lean years leading to nil dividends and is not a suitable source of reliable yearly dividend income like EPF.  If you want stability of yearly income, invest in EPF.

The strategy with Cyclicals is Price Gains.  Simply put, buy when it is low, and sell when it is high.  Never lose sight of this fundamental goal.  Everything that Analysts say or what everyone else say in investment forums should be ignored.

The risk with this strategy is what goes low, can go lower.  I showed some price levels.  There are no guarantees with these price levels.  They can break, they can fall.

Your safety is intrinsic.  You know the business is worth 96 sen.  Excluding the land, it is worth 74 sen.  If price falls to these levels, or lower, you want to keep buying more, because this company has a long proven history to share profits with you.  However, to make sure your portfolio will keep making new all time highs, you don't want to have too huge a position size.

If neutral position size is 3%, at the bottom, it should not be more than say 5% portfolio.  I highly doubt it will sell at 74 sen, but if it does get there, we know getting to RM1.50 (or doubling) is many times more likely to happen over next 5-10 years.

Hence, I would aim to get to 3% portfolio near the 61.8% Fibonacci level.  

As price falls, my value will fall and I will slowly add to keep it around 3% and higher slightly.

  • Around 1.10, I may aim for 3.5% or more.
  • Around 1.00, I may aim for 4% or more.
  • Around 0.95, I may aim for 4.5% or more.
  • And below that, I may aim for additional 0.5% capital or more.
  • These are just high level thoughts.

They are not cast in stone - every quarterly report provides an opportunity to review the fundamentals of the company to re-evaluate if the business fundamentals have change.

In terms of target price, over next 5 years, getting to RM1.8 is very good odds.  Ignoring dividends, it should meet your 9% per annum return criteria.  It could take longer if global market enters a crash and recover.  It could be sooner too if the situation overseas resolve itself sooner. 

Risks with this strategy

The founder and his wife are both late 60s.  Typically, where the business is today is because of them.  The bumper year in 2022 is a typical result after many decades of getting ready for this.   It is safe to say that if the founder is no longer around, there will be disruptions that may have repercussions not only short term but potentially longer term.   Whilst their children have been in the business for a decade, this reduces the risk but doesn't eliminate the risk completely.  Hence, at the bottom, never own more than 5% portfolio.

The reliance on exports to Europe and North America, and reliance on Vietnam as inputs adds forex volatility risks but is also opportunity to diversify.   As I have a highly diversified portfolio, I'm fine with this and doesn't bat an eyelid.  Nobody can predict forex movements over the long term.

The stock price can stay low for a very long time, and for a strategy in cyclicals where dividend yields are less reliable, this could depress the portfolio returns longer than expected.   Fortunately, I don't need to the dividend income to spend yet, I expect to still have other sources of income over the next 5 years, it's a non-issue for me.

Whilst the company has a proven history to share profits with shareholders, the most recent nil dividend declared is slightly perplexing, as they always share 40% profits.  Once, during tough times, they shared more.  However, not a major issue because to me, I suspect management is trying to be responsible to send the message that the upcoming 6 months can be expected to be tougher i.e. don't expect earnings to be positive (i.e. nil dividends).   So, the base case is there may be better buying opportunities coming given this announcement of nil dividend.  In theory, as the next 2 quarter results are announced, watch out for price  divergence signs, especially if price doesn't go lower on negative earnings.

Stock market crashing always open up opportunities elsewhere.  Besides utilizing market crash cash reserves (these are held as cash solely to capitalize), it is a viable strategy to sell CHINWEL too, to raise cash and buy other stocks that will recover faster.   Likely CHINWEL will hold its value better than other stocks when market crashes, due to its high Net Cash position.  Hence, market crash and temporary loss in CHINWEL is very welcome opportunity!

Summary and Conclusion

1. Target 3% capital near 1.18.
2. Own a bit more at lower prices due to the high Net Cash position.
3. Never own more than 5% capital for this stock.
4. Have at least 5-10 year horizon for this stock.
5. Welcome broad market crash, which is opportunity to swap into better stocks that will recover faster after market crashes.

Thursday, April 4, 2024

FPI

 I like this stock from both fundamentals and long term chart perspective.


Long term Chart

Usually, the good ideas tend to jumped out at you, and the chart below just jumped out at me. 
Odds look high, that the long term investor is going to profit from this type of chart / price action, when combined with excellent fundamentals (but nothing is guaranteed in markets).


Past 10 years business performance

The past 10 year's CAGR looks good, but too good to be true from future perspective?  
True 2014 EPS and DPS starts from a low base but even if we look at 9 year CAGR for EPS or DPS, this stock has proven its superior past performance.
Nevertheless, the past doesn't guarantee the future (even if at least this company has proven itself in the past very successfully). 
It's a stock where we want to consider own a full position or more near the local bottom.


Note:

1. The current dividend yield is at least 7% per annum.  My personal long term assessment of its dividend yield is around 6% per annum, matching/beating EPF.  Very nice and good odds to be sustainable (although there may be a short term bump down).

2. It's Net Cash is around RM1.40, when price is RM3.13. 
This means net of cash, the business is valued at 3.13 - 1.40 = 1.73.   
My long term assessment of its EPS is around 25 sen, factoring in the upcoming bump (even if TTM EPS is around 45 sen). 
If you assume EPS=25 sen first, the business is available for sale with a P/E of 6-7 times only. 
If you assume TTM EPS of 45 sen, the entire business is available for sale with a P/E of 4 times only.
Either way, whether 4, 5, 6 or 7 times, it is a very undemanding valuation. 
The cheapness (Price vs EPS) just jumps out at you.

3. This company has proven to have grown its Net Cash over past 10 years.  It's clearly above average, good to excellent quality business over the past 10 years.  

4. The Management of this company has proven itself to share its Net Cash with shareholders the past 10 years through generous dividend yield. 

5. The stock is available for sale during the corrective wave, i.e. it is not exactly chasing and buying on a breakout, but on pullbacks.  There's some fears about declining revenues in the current year, as it's quite a sizeable drop for FYE2023 vs FYE2022.  The drop may not be over yet.  The question is - is this drop permanent, or do you trust Management to solve this temporary problem over the next 5-10 years?  Price looks fair to me for an above average quality business.  

6. There's potential for a price gains in the future.  It's NTA is currently 2.10, where 2/3rds is Net Cash.  It could consider a special dividend one day (a nice bumper gain) and this will also improve its capital efficiency, giving even greater returns to shareholders.

Major Shareholders

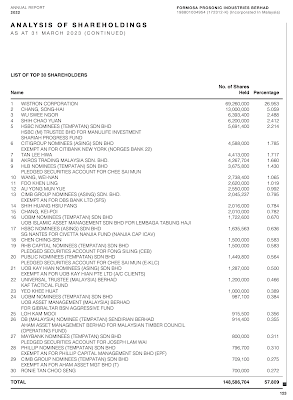
Interestingly, the only major shareholder is Wistron owning 26%.  The rest are minorities.  Top 30 only owned 58%.  Feels a bit too low, not quite understand why this would be the case ... (perhaps it due to its ageing Group MD and management?).


Target Position Sizing

At the right price, this stock may deserve an over-weighted position.  If my neutral position size is 3% capital (roughly equivalent to 33 long term investing position), then, this stock deserves at least 4% or more (but see below for what I don't like about this stock too).  The business fundamentals the past 10 years is good, the management is good (trustworthy enough to share their profits fairly with shareholders, maybe can do a bit more), the chart pattern is good (for long term investors), this one can buy during dips to get to a full size position.

What I don't like about this stock?

Every stock has risks, and sometimes, it's good to play devil's advocate to a stock that you like.

Here are some reasons why I don't think it's wise to own too large a position.  If neutral position is 3% of one's portfolio, then, too large a position could be say doubling or 6%.

1. The drop in revenues in FYE2023 vs FYE2022 is quite large.  The EPS in 2023 is supported by one-time gains.  Next year FYE2024 could show a sizeable shrinking in EPS.  Hence, I think 25 sen is a good estimate of its long term EPS, notwitstanding it earned much higher from 37-46 sen the past 3 years.  At 25 sen, it is still cheap.  However, there's always risk that its future revenue might never make all time high over the next 2-3 years again i.e. it could be a long wait.   However, its dividend yield is attractive, but if EPS is too low, future dividends might be cut.  Nothing is guaranteed.

2. Related to 1, the business can be regarded as niche, dealing with speaker systems, acoustic products.  It's client base is smaller and niche so, there's a higher business/revenue risk than say MAYBANK, due to smaller potential customer base and competition.  Whilst it should beat MAYBANK returns over next 5-10 years, it pays to be cautious.  Both are good in their own ways.

3. The Group MD, responsible for past success, is a 68 year old Taiwanese who was appointed in 1989... has the alarm bell rung yet?  Who will be its successor? Given the large decline in 2023 revenues, does this ageing Group MD still possess the necessary drive to turnaround FYE2023 declining revenue?  

4. The stock market cap is only RM800 million - looks like a small cap to me.  Small caps are volatile - they can give big wins but they are also riskier and has higher chances of dropping a lot.  Hence, not more than 5% of one's portfolio.  

5. There's no rule that says that Management can't continue to hoard its Net Cash in the future, especially if the Group MD is getting older.  All else equal, older management are typically more conservative.

6. Charts are fickle.  Odds are never certain.

7. Over next 10 years, it's almost a certainty that KLSE will face a market crash.  Odds are high.  In the event of a crash, this stock will crash more than say MAYBANK.  

8. The stock is not well covered by analyst.  According to i3, there's no coverage.  This is both good and bad.  The good thing is if one day it gets coverage, the stock is likely to run.  If not, we continue to collect its nice dividend yield, well supported by its net cash.

9. Can't find its capital commitments in the last quarterly report.  This can raise eyebrows, because R&D seems essential over the long term for future growth, and not too clear from the Quarterly Report on how much it is investing for its future growth over the next 5-10 years.

Hence, for long term wealth accumulation, never be greedy.  Overweight from neutral at the right price, say 3.5% to 4%, and that is probably good enough.  If there's no opportunity to further add, that's fine too

Investing Strategy & Timing

Overall, I still feel positive about this stock.

Price action feels favorable overall.  Since Sep 2021 peak, it has clearly entered a corrective wave phase.  Today is March 2024 i.e. it has been consolidating for 2.5 years.   Normally, this feels like we are getting close to the bottom, before the next impulse wave up that could last for several years.  Nothing is guaranteed of course, but a chart reader plays the odds.

Additionally, I feel the odds of pullback and retesting is more than 50/50.  Hence, over the next few months / 1-2 years, we will get a chance to buy cheaper than RM3.13.   My immediate target is around 2.85.  

I currently own this stock.  At 3.13, it is 3.1% of my portfolio, so, I am already slightly overweighted relative to neutral.  My average buy price is RM2.63.  I first entered on 3 May at RM2.69, continue to buy on the way down at RM2.32 but didn't buy enough, then, buy more on the way up as high as RM2.87 to get to near 3% capital.  

And this is good enough to give me a paper gain that is larger than my biggest short term swing trading win.  (I trade using a smaller position size, than my long term investing position).

Summary and Conclusion

Some ideas jumped out at you, and this one certainly did a few months ago.

We can never get our entry timing precisely right and we don't need to. 
Whilst hindsight is 20/20 and it's easy to feel like I should have loaded up when price fell to 2.32, but this kind of thinking is wrong thinking because nobody knows the future.   
Additionally, it's actually not a bad idea, if one's position is not yet full, to be able to buy when price went back up.
I pat myself at the back for forcing myself to get to a full neutral position at least with this stock, even if it means chasing up to 2.87.  This is because at 2.87, the valuation is still compelling.   That was in early January 2024.

Nevertheless, after nearly 3 months of watching its price action, I suspect over the next few months/ 1 to 2 years, there is good chance to see 2.85, when I plan to load up a little bit more to perhaps up to 3.5% to 4% (depending).  It's certainly on my watch list.  If it falls below 2.85, that's okay too in the short term, as my game plan is over a much longer time-frame.

Over the next 5-10 years, the odds of making a new high looks better than 50/50 from chart perspective (even if the Group MD is now 68 years old).  And the dividend yield is nice 6% or higher per annum and growing.  And net Cash growing too.  

Hence, decent odds to beat EPF's 5.5% to 6% per annum returns over next 10 years.  It's worth a solid position in one's investing portfolio, slightly larger than 3% neutral position IMHO.

As usual, never get greedy, no matter how attractive a stock is.  Every stock has risks. 

And never be stubborn.  Eventually, price action will reveal itself, and when it does something different that what is expected, be mindful to review and reconsider our initial thesis.

Sunday, March 24, 2024

Should you Average Down or not?

I first heard of the concept of "Averaging Down" over 3 decades ago.

It started off with positive intention from its cousin "DCA" or "Dollar Cost Averaging".  Instead of investing say RM120,000 at one go, you should consider buying RM10,000 per month over 12 months instead.  If market goes up and goes down and by the end of the 12 months ended up exactly the same price, you'll end up owning more shares, than if you had bought it all at one go at inception.

Dollar Cost Averaging (DCA)

Here's an illustration of DCA.  Imagine you have RM120,000 to invest when Price is RM1.  If you buy at one go, you'll have 120,000 shares.

Now, consider the alternative method - break the RM120,000 into 12 equal parts and invest each month.  Price goes up and down during the next 12 months and if price gets back to the same RM1, you'll end up owning more shares due to the price volatility.  In this illustration, when price went up, then, come down, and then recover back to RM1, you'll own more shares at 124,049 shares, instead of 120,000 shares.

So, why does DCA work in flat markets?   
Simply put, it forces you to buy more shares when price is low, and forces you to buy fewer shares when price are high.  
As a result, 12 months later, you own more shares with the same outlay.

So, summary pros and cons of DCA.

Pros - Works great in 2 kinds of markets:
  1. Flat markets and
  2. Markets that declines temporarily and 100% sure to recover back (nobody knows the future though).  
Cons - 3 important disadvantages:
  1. Not so good in rising markets (you'll end up owning less shares in a rising market)
  2. You'll lose much bigger in $ terms if it goes down and stays lower than your entry price forever
  3. The worst of it is when it goes down to zero (then, you'll lose everything).
Averaging Down (AD)

So, what's the difference between "Averaging Down" and "DCA"?
The difference is when prices are higher - you don't buy.  You only buy when prices are lower.
So, this has pros and cons too.

Market Type 1 - Volatile flat market - a market that goes up/down and eventually comes back to original price. 
  1. In this type of market, Averaging down has pros and cons relative to DCA. 
  2. If you believe Position Size determines your final returns more than Entry Price, then, DCA  typically gets you to full Position Size than AD, because in DCA, after "n" month, you'll end up with full Position Size regardless of whether market goes up or goes down.  Whereas AD might only get you a tiny position if after the initial move down to give you 1/12th the position, price then went up higher than stayed higher.  
  3. However, if you can get in full position with both methods, the difference is likely to small in the long run after 100 stocks.  In practice, you're unlikely to get a full position with Averaging Down in all 100 stocks.
Market Type 2 - Rising market - the market price keeps rising to be higher than original entry price
  1. In this type of market, DCA is superior to AD because it keeps adding more shares on the way up to full position size, to give you a bigger $ win, whereas under AD, you only have 1/12th at entry and then, that's all you have.
  2. In a generally rising market (and if you have 100 of such markets), DCA is clearly superior than AD simply due to differences in position size.
Market Type 3 - Declining market - after entry, price keeps getting lower and lower
  1. In this type of market, if the total outlay is the same, then, both are similar and the same.
  2. Over 12 months, you keep buying more at lower prices and eventually, you'll own a full position.
  3. If price goes to zero, in both cases, you lose everything whether DCA or AD!
In conclusion, which is better?  DCA or AD?

According to Buffet teachings on stock selection, neither is better.

What is more important is it's future price action.

If the stock's business economics is of superior quality (e.g. it is in a superior type of business, a monopoly, have an economic moat, etc.), is run by able, honest and trustworthy management, and is available at an attractive price (where future price will be higher), then, it's future price action is likely to be rising.   Then, your risk here is not getting a full position.  You don't want to be owning only 1/12th of a full position - here, DCA is superior than AD, but an immediate buy at full position is superior than DCA, if you have picked the correct stock at the right price.   However, if you have 1-2 months to accumulate, then, odds are usually some form of averaging typically gets you a little bit more shares but in the long run, they don't make much difference, compared to finding that superior stock.

In short, future price action is key.   You want to find a rising market, where the price action is likely to be rising, where "a rising tide raises all boats".

And if its future price action is downtrending, and possibly heading down to zero, then, avoid at all cost.  
  • Don't even bother to own a piece.  
  • Ignore, disregard and move on to other markets.   
  • There are thousands of stock with markets to trade.  Get in them.  
  • Don't be stubborn.  Let go of your losses and move on to find new markets where future price prospects are likely to be rising.   
  • Invest there, so that your portfolio keeps making new all time highs!


Saturday, March 23, 2024

CARLSBG Update

 Previous article on CARLSBG here.

Annual Report Update

CARLSBG published its annual report on 22 March, and reading this over the weekend, I see no major surprises to my long term assessment of this business.  To me, the quality of the business remains decent, above average, I can rely on this to deliver at least 8-9% per annum long term returns, and is worth a neutral position size (3% portfolio or more).   This remains a business where the lower the price, the more I accumulate up to neutral position at the bottom.

Chart Update


The long term chart is self-explanatory:
1. After the long bull run from 2009-2019, we are now in corrective wave phase.   
2. My guess it if last time took at least 10 years to correct and find bottom, this time will be different.  
3. There is the 61.8% Fibonacci retracement, confluence with previous high and previous lows, suggesting the major bottom to be around RM17.   For this long term chart, that could take a while (months, maybe even longer). 

10 Year Business Updates
 
Self explanatory:
1. 10 year EPS CAGR growth is 5.2% per annum - that's decent, and rates a B.
2. 10 year DPS CAGR growth is 3.0% per annum - that's decent and rates a C+.
3. 10 year NAPS CAGR shrink 3.4% per annum - not quite sure why, but that rates a C-.
4. 10 year RPS CAGR still growing 3.6% per annum - that's slightly higher than inflation rate and rates a C+.
5. Latest dividend yield = 5% (93 sen / 18.5 say) - that's high, and since it's sustainable, rates a B+.  For a dividend investor, combining long term dividend growth with long term business growth, that has very high odds of beating EPF.

Future Price Required, to earn 9% per annum total returns

My long term investment objective is modest - as you know, I aim to beat EPF long term 6% per annum returns.  My personal target is 9% per annum.  The question is how do we know if CARLSBG can deliver 9% total returns per annum over the next 10 years?

The truth is we don't know.  Noone knows the future.  All we know is to align ourselves with probabilities.  

One way for long term investors is to ask this simple question.  If long term dividends give me 5% per annum, what kind of future prices do I need to see, before it delivers 4.5% per annum long term (to give 0.5% buffer)?

My Future Price Required Calculator shows what kind of prices I need to see, in 1, 2, 3, 4, 5 and 10 years time, if I were to sell after commissions.  

It's not a very high ask.  To get 9% total returns per annum over next 5 years, CARLSBG needs to get back up to RM23.3, which is not even the peak of the corrective wave (B).   Over the next 10 years, CARGLSBG needs to get back to RM29.1, well below it's all time high of RM39.

In short, over the next 5-10 years, I think majority odds, that CARLSBG will deliver 9% per annum, if enter at RM18.54.   If you enter at a lower price, the odds increases substantially.

This is not a short term strategy - it's at least a 5-10 year strategy for long term wealth accumulation.

Target Position Sizing

Previously, I shared that my position size is around 2.4% portfolio.   Today, it has shrunk to 2.2% portfolio (excluding past CARLSBG cash dividends received), as my portfolio has grown (from other gains and also CARLSBG past dividends received), and CARLSBG price has shrunk.

My target remains around 3% when CARLSBG gets into my accumulation zone where I think the bottom is around RM17 which can take several months, or even 1-2 years to get there.   Meanwhile, I'll continue to collect the 5% per annum dividends.

Another reason to limit at 3% at the bottom is because I also own HEIM.   Similar target position sizing.

Conclusion
 
For long term wealth accumulation, the investment strategy is simple and easy to follow for someone who wants to spend his life doing other things than investing or trading.  As Buffett says, the key is to "start early".
  
1. Accumulate quality businesses at fair/lower prices.  
2. Have a clear strategy on when to enter and eventually, when to exit.
3. Position size appropriately.  Never bet everything on a single business.  Ideally, diversify at least 30-50 different businesses when the opportunity arises and we are able to accumulate at the right price.
4. Once we secure them, forget about this stock when after it finds the bottom.   
5. Be patient.  It is good to collect 5% per annum dividends every year.   Doesn't quite beat EPF, but close.
6. For CARLSBG, the strategy to beat EPF even though dividend yield is smaller, is the additional price gains.   If previous bull run took 10 years, be very patient and do nothing during the bull run and just wait it out.
7. Eventually, the Price gain in 5-10 years time will deliver total returns exceeding 9% per annum, here, likely by quite a distance if it makes new high (which over next 10 years, has at least a coin toss odds of 50/50).  A doubling of price gains over 10 years is 7% per annum, giving total returns of 12% per annum.  If it gets there in less than 10 years, the CAGR is even higher than 12% per annum.  This is very very good for the long term investor.

This stock is not suitable for the impatient short term trader looking to earn 10%, 20%, 30%, 50% or 100% returns over months (and after 100 trades, see his account dropped or doesn't beat EPF).  CARLSBG is a boring stock.  Precisely because it is boring, and precisely because there is good management team to manage this business to provide returns to shareholders, that you want to have some of your net worth to partially own this business.  Let the professional management team grow your wealth.   

Sunday, March 3, 2024

BAT Declining EPS/DPS - How much is the stock worth?

Intrinsic Value / Valuation is tricky.  There are many different ways to value a business.  Buffet and Graham's method is to have an adequate Margin of Safety.  In other words, we want to be prudent, by giving ourselves an ample Margin of Safety so that even when we are wrong, we still make monies.

I've blogged about BAT before here.  

BAT recently published its quarterly report and closed the year.  To keep it simple, FYE2023 EPS and DPS is 68.2 sen and 63 sen respectively.  8 years prior, BAT EPS and DPS was 318.7 sen and 312 sen.   This means that the EPS and DPS CAGR over the past 8 years are -17.5% and -18.1% per annum respectively.   

Let that sink for a minute.

Every year over the past 8 years, BAT EPS and DPS shrunk around 17%-18% per annum consistently.

BAT current price is RM8.2.  

  • With EPS of 68 sen, its P/E is 12 times
  • With DPS of 63 sen, its P/DPS is 13 times.
The question is - is the business worth 12 times current earnings (or 13 times current dividend)?
It really depends on future EPS and DPS growth rates.

This is where it gets tricky - everyone will have different views about the future growth rates.
Will it continue to shrink?
Will it stop and turn around?
Does anyone knows the future?

This is where Buffet and Graham's brilliance lies.
When nobody knows the future, they want ample Margin of Safety.
In other words, make conservative assumptions, calculate the Intrinsic Value, and wait for Price to fall below Intrinsic Value at a margin and then, only trigger the buy.

So, what conservative assumptions should we make?

I offer you 3 scenarios, to understand the mathematics of Intrinsic Value.

Scenario 1 - Aggressive - assume no shrinkage, no reduction, i.e. assume EPS and DPS has found the bottom.  In my opinion, this is a very aggressive assumption over the next 10-20 years.   

Scenario 2 - Ambitiously realistic? - assume the rate of shrinkage reduces by 2% per annum, i.e. eventually earnings is flat forever.  This gives credit to current Management who tries to reduce the shrinkage in earnings and dividends.

Scenario 3 - Prudent - assume rate of shrinkage reduces by 2% per annum from -16% down to -6% and earnings shrink at -6% per annum flat thereafter.

What does the results look like?


I project the EPS for only 20 years for prudence.
My discounting rate is 8%.  Why 8%?  Because I can safely invest and earn 8% p.a.  This is my required rate of return.  

So, how much is BAT's Intrinsic value worth under 3 different scenarios?

In Scenario 1, if BAT's earnings remain flat at 68.2 sen forever, then, the stock is only worth RM6.70 to me.

In Scenario 2, if earnings initially shrink by 16% but improves over the years and eventually stays flat, then, it could be worth RM4.00.

In Scenario 3, if earnings keep shrinking at an ultimate rate of -6%, then, it could be worth RM3.60.

Sanity check.  BAT Net Tangible Asset (NTA) is RM1.32.

Summary and Conclusion

BAT's price has crashed substantially the past decade.
It's peak price is near RM75.  Today it's only RM8.2.  Is this a cheap stock?

Unfortunately for BAT business, its EPS and DPS continues to shrink the past 8 years.
It's business appears to be sun-setting.  
It's revenue continues to shrink.
It's hard to imagine for hard core smokers but there are less customers smoking BAT's products.
Instead, it's being persistently replaced with alternatives.
And these alternatives doesn't bring in the same level of profit margins and revenues like it did before.

The huge question mark is how long will it take the business to settle.
Nobody knows the answer to that question.
Because of that huge uncertainty, that's where Buffet's and Graham's brilliance comes in.
They insist on having an ample Margin of Safety in the valuations.

3 out of an infinite scenarios are offered here for prudence.
They indicate that the fair value is probably around RM3.50 to RM4.00 based on today's Intrinsic value.
Which means RM8.2 is still not cheap.

Final thoughts

Noone knows the future.
As retail investors ("bilis"), we can't afford to under-perform EPF returns.
EPF gives us 5.5% to 6.0% per annum long term returns for "doing nothing".
If we want to invest in stocks ourselves (instead of parking in EPF), then, we demand at least 9% per annum returns (or at the bare minimum, 7%-8% per annum returns if we DIY).

We don't lose any monies if we don't invest.  
We make 5.5%-6.0% per annum long term if we park in EPF.
My illustration above showed that to earn 8% p.a. returns in a declining EPS/DPS scenario, the stock needs to be trading at around RM3.60-RM4, before I start to be interested.  
In fact, I probably need another Margin of Safety, of possibly 30% buffer.  
This suggests, I could probably trigger a long term buy at around RM2.50-RM3.

In short, RM8.20 is still too rich for me.
To each, his own.

Tuesday, February 27, 2024

HEIM

 Long term chart


Approaching LT support trend line going back to over 15-17 years old.

Fundamentals/Business Considerations

Past 10 years:
  • RPS CAGR ~ 5.3% p.a. (decent i.e. C+)
  • EPS CAGR ~ 7.3% p.a. (i.e. past 10 years management has worked to squeeze more profits from same revenue, decent i.e. B).
  • DPS CAGR ~ 7.5% (close enough to EPS growth - it suggests nearly 100% dividend payout ratio - decent i.e. B).
  • NAPS ~ 2.7% (suggesting that it does retain some earnings somehow due to differences between earnings vs cashflows.  Decent C).
Based on past 10 years stats, this stock can be reasonably expected to grow roughly inline with long term CPI+GDP growth i.e. say 3%+4.5% ~ 7.5% which is close to its EPS/DPS growth.   Clearly above average stock quality.  (Overall Grade is say B-)


My personal prudent estimate of its long term dividend ~ 125 sen.
(TTM is 128 sen i.e. higher.  Prior year 138 sen, i.e. price dips because TTM DY is lower than prior year).  

My guess on a decent accumulation zone is around RM22.

This gives a decent initial Dividend Yield of 1.25/22 = 5.7%.
Additionally, this Dividend has 50/50 chance of growing at 7.5% per annum long term.
It's a business worth owning when the price is low, when pessimism is higher than normal.

Investment Targets

As usual, we consider Dividend Yield plus reasonable Price Gains.

1. Expected Dividend Yield around 5.5%-6% (say 5.5% for prudent).
2. I'm looking for a conservative 4% p.a. price gains over next 5 years.  Allowing for 1% in and out commission, assuming a Buy Price of RM22, the target prices after year 1, 2, 3, 4, 5 in order to deliver 4% p.a. are as follows:


From the above long term chart, the highest price is higher than RM30.
To get 4% p.a. price gains alone in 5 years only requires the stock to exceed RM27.1.
This looks like a very high probability of happening over the next 5 years.

In short, this passes my criteria of beating my 9% p.a. benchmark return.

Target Position Size

My neutral position size is 3% capital.  (roughly correspond to 33 diversified businesses).
I am currently slightly underweighted at 2.2% capital only.   However, I also owned CARLSBG at similar sizes.   I slightly prefer HEIM over CARLSBG.  It's probably not so prudent to exceed 5% capital for both given the 33 diversified businesses.

Hence, I hope to be able to add 0.6% capital as price approaches my buy zone.

What if Price breaks below the long term trend line support?

My purchase is based on fundamentals/business considerations.
So, charts are mainly for indicative entry price, and give more colour on probably long term price gains with high probability.   

Therefore, if price breaks below the long term trend line support drawn, I will not cut loss.
Instead, I'd be more interested to add more, to get my position here to be slightly higher than neutral (after price settles).  

Summary

HEIM just reported its last quarter report.  
It finished the year at a slightly weaker note, compared to a strong 2022 rebound after the economy reopened.  
The company viewed the dip as a form of "market correction".  
It is cautiously optimistic for 2024.  
My gut feel is the company's guidance is about right.  

It's not going to be a star performer in 2024.
But it is above average quality business.
It's the kind of company that I will consider owning in its entirity at RM22 and hold for at least 5 years.
I believe there is better than 50/50 chance, maybe as high as 80% chance, that it is able to deliver at least 9% p.a. over the next 5 years or longer.     

I like it that it is a boring stock.    
It means I can own this, together with my other 30+ investing stocks (excluding trading stocks) in my diversified portfolio, to grow my net worth slowly and safely.  
My gut says very high odds of beating EPF over the next 5 years too.

However, nothing is certain in investing.
Hence, I am not planning to own this more than 3% of my capital, only because I already have CARLSBG too.


Friday, February 23, 2024

Mathematics of Long Term Personal Savings - 2

Continuing the series from the last article here.

Recap Summary

  • The graduate is 22 year old when starting work as a professional in a multi-national organization.
    • Work for 38 years (age 22, retire age 60)
    • Starting monthly salary of 3.5k in the first year, and eventually end with 30.3k monthly salary at age 60 in the final year.  
    • Total salary received over working lifetime ~ RM8m
  • Saving 20% monthly salary in EPF for 38 years (assumed to earn 6% p.a. long term) gives the final accumulation at age 60 of RM4.6m.
  • Saving a further 10% monthly salary in a self managed stock portfolio (assumed to earn 10% p.a. long term), despite only half the EPF savings, gives a final accumulation at age 60 works of RM4.9m, bigger than EPF.
  • The total combined savings of 30% of monthly salary every month for 38 years will accumulate to the sum of RM9.6m at age 60.
    • This is roughly equal to 26 times final annual salary.
    • The  amount should be able to last the retiree and partner for a lifetime, assuming both lives up to age 100.

Education Spend - say RM1 million

Imagine a scenario where the parent of the child is thinking to spend RM1 million, to send the child to overseas to study.  
  • Assume study period is 5 years (1 year matriculation, 4 years university, or 3 years Bachelor's degree, 2 years Masters/higher degree).  
  • Let say total costs is RM1 million for now.  If your actual number is different, you may pro-rate / scale this number up or down.
  • Actual amount will differ, and will vary depending on many factors.
The question is - how much will RM1 million today accumulate to 38 years and to 43 years (add another 5 years), if saved in EPF to earn 6% p.a. interest instead?


The answer may shock you!

Just 38 years of accumulation (starting at age 22) at 6% p.a. interest turns the RM1 million today into RM9.7 million at age 60!

This accumulation is LARGER than the graduate working, saving, self-investing for 38 years!

Saving RM1 million in FD

If you are a salaried person planning for your child's future education, how long will it take you to save RM1 million in FD?

Recall the previous article which assumes the same graduate saving for RM1 million.


This is not identical, but assume the parent saved 30% of their monthly salary into FD.  The table above showed that it would take up to 19 years to be able to save RM1 million.

What if the education spend is halved to RM500,000 instead?

1. It would take the parent around 13 years to save, if the parent salary progression is the same as the graduate child.  (it takes longer for compound interest to work).

2. The investment of RM500k over 38 years in EPF will grow to half of 9.7m, i.e. RM4.8m i.e. half of the child's accumulated retirement savings after 38 years of working, saving and investing.

The Question

Knowing these financial mathematics, would you reconsider saving for 13/19 years, to accumulate either RM500k/RM1 million, so that in 13/19 years time, you are able to afford to "invest" in your child's education?

How much of the RM500k/RM1 million is really an "investment"?

What is the ROI / outcome of the "investment"?

Is the outcome really an investment if to match the EPF savings, it will require the child to work for the next 38 years, saves 30% of monthly salary for 38 years, invest and learn self-investing for 38 years, in order to accumulate a final amount 38 years later to equal the alternative of "Do Nothing but invest RM1 million for 38 years in EPF".

How much of the RM500k/RM1 milliion really is an "investment"?

The Reflection

For those of us who received overseas education 3-4 decades ago where the cost of overseas education was extremely cheap and when the Ringgit was so much stronger, studying overseas was a viable option to more Malaysian parents back then.

However, today, when the Ringgit has weakened so much, and the cost of overseas education has risen faster than normal inflation, is sending our child overseas still a viable option as before, or only available to a constantly reducing group of hardworking Malaysians barely making into the elite group?

Clearly the world and Malaysia today is no longer the same as 30-40 years ago.

Saturday, February 17, 2024

Mathematics of Long Term Personal Savings

Background

I am always fascinated with the mathematics of personal savings, from the time a graduate enters the workforce, until s/he retires at the age of 60.  

I start with 4 groups of questions first:

  1. Salary progression.  What is a typical salary progression of such a graduate, if s/he gets a professional job, climb his career until mid level manager and then never made higher until retirement?  How much total salaries made over lifetime?
  2. EPF savings only.  If he were to only save in EPF to earn a long term interest rate of 6% per annum, how big would such an accumulation grow to?
  3. Long term equity investing.  What if he supplements with long term investing, to earn 10% per annum?  How big would such an accumulation grow to?
  4. Only FD investing.  What if he only save in FD to earn 3% per annum, without EPF, without investing?  How much would that kind of accumulation grow into?

1. Salary Progression

Let's consider a typical case of an "average person" who graduates, find a professional job, and work his way up to middle management/specialist i.e. not a particularly ambitious career person.

  • Graduated at the age of 22.
  • Obtained a professional job immediately (such as an engineer, an accountant, IT, etc.).
  • Say a monthly starting salary of RM3,500 per month in the private sector.  
  • Say a yearly salary increment of RM1,000 per month each year up to age 29 (up to RM10,500 per month), as he diligently work and climb up the professional ranks in a bank/multi-national organization.
  • Say 5% per annum salary increment from age 30-34
  • Say 4% per annum salary increment from age 35-39
  • Say 3% per annum salary increment from age 40 onwards
The questions are what would the salary progression looks like?


In short, the individual would be looking to triple his/her salary by the time he reaches age 30 to earn a 5 digit salary.  After that he just cruises till retirement.  In this scenario, total salaries made is nearly RM8 million over 38 years of working!

Quite a substantial sum isn't it?

2. The Power of Saving in EPF

Let's assume that this individual made 20% savings into EPF, where 9% is member contribution and 11% is Employer contribution.

This is on the lower side, as some employers made higher EPF contributions.

Assume EPF earns 6% per annum interest historically, which is a very good long term returns.

In this scenario, how much will have this person's EPF have accumulated?  What is the multiple of the Accumulation relative to his Annual Current Salary?

Here's what it would look like:


By the time he hits age 30, his EPF balance will have grown to 200k, or 1.5 times annual salary.
By age 40, 813k EPF balance equal to 4 times annual salary.
By age 50, 2.1 million EPF balance equal to 7.7 times annual salary.
By age 60, 4.6 million EPF balance equal to 12.7 times annual salary.

Not too shabby right?  
So, what's the learnings here?

EPF is not a bad savings vehicle.  You can actually accumulate to large amounts of monies for an average person, with just EPF.  The key factor is have a good job that provides a lasting salary and time.  Without a salary and the ability to save in EPF, this avenue will not be available to you.

3. What if it's just FD savings?

What if you don't have the opportunity to save in EPF, but only save in FD?

What if you increase your savings by 50% bigger, but only sock it in FD?

Let's assume FD pays 3% per annum interest over the long term.

What does the comparison looks like?


So, over this 38 year period, total EPF savings is 1.6 million, vs FD savings of 2.4 million i.e. the FD saver saved 50% more.

However, despite saving 50% more, his accumulation by the age of 60 is smaller.

In short, not a very smart way of saving for the long term isn't it?

4. What if you learn how to invest safely?

What if you could learn how to invest and earn 10% per annum safely over the long term?

What if, instead of saving 30% of your salaries to sock into FD, you put 20% in EPF and 10% into a portfolio of very sound stocks that pays say 4%-6% dividends and the rest via price gains?

This is actually not far fetched and is very doable.  But what would your accumulation looks like?


The answer boggles one's mind!

The extra 10% savings only works out to be 808k total.
But with 10% per annum returns, it is able to grow to 4.9 million!  Exceeding EPF despite just half the savings.

The total accumulation (20% EPF + 10% diversified shares) is RM9.6 million.
This equals 26.2 years of last annual salary drawn.
This should be able to last for a lifetime - even if you retire at age 60 to live up to a ripe old age of 100.

Summary and Conclusion

1. It is possible for an average person to accumulate a massive amount provided there is discipline and commitment.   It starts with having a good, stable job.

2. Then, the habit of saving something everytime.  If you start saving as soon as you graduated and learn how to live within your means, the first year is the hardest, but after that, the rest becomes habitual and easy.  Learn good habits early.

3. Then, save in EPF to earn 6% per annum long term interest.

4. Then, learn to invest safely in equities to target 9%-10% per annum long term interest.  Here, the strategy is simple - invests in a diversified stock where the underlying business is good, generally grows its EPS, DPS and Net Assets over long periods of time, aim for stocks that pays at least 3%-6% dividend yields and grows them sustainably.  Diversify to 20-30 of such stocks.  Buy them when the price is lower.  Basically, learn from Warren Buffett (who achieved so much more than 10% per annum).   Dividend stocks with a long history of paying out dividends to shareholders are generally safer - they may be boring, but with commitment and discipline, you can amass a good fortune over your lifetime.  And this strategy is scaleable - you can do this with 100k, 1 million or even 10 million.

Final Reflections

The thing with time, is we all have the same amount of time everyday that we are alive.
(if we die earlier, it doesn't matter that we die broke, because we'll be already dead).

The thing with living a long life, is that we only have 1 shot at life to make monies when we are in our productive years.
(squander this, and your old age will be miserable).

Live a good life, enjoy life, but put aside some monies too for the future (and make that opportunities count, because if you plan to invest for 20, 30, 40 years, you probably only have 1 shot in your life to do this).


HLIND

Long Term Charts 

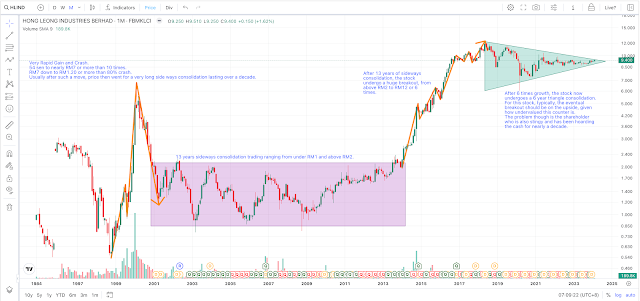
Here's what I'm looking at with HLIND over the past 25 years.


Massive Net Cash

There's no question that HLIND business is a cash generating machine.  HLIND grows its Net Cash at the rate of 33% per annum CAGR compounding.  This is a crazy company!

The value of the Net Cash is nearly RM5.  The stock trades at RM9.40.   The rest of the business is only sold for RM4.40, which is cheap considering 1 year EPS is typically around 90 sen or thereabout.  Doesn't take much to realize there's massive value there, as the business is only sold for a P/E of less than 5 times.
Summary Financials


Since 2015:

1. Dividend growth is impressive with CAGR of 8.8%.  That is very nice.
The only time when it lowered dividend is during COVID pandemic year in 2020 - that is understandable.

2. EPS growth is generally growing.  Which is nice.  
It is more volatile than dividends which is normal.  
CAGR of 6.4% is decent, but not great, as it is dragged by the high cash balances.  Not efficient capital management.  
This type of cash hoarding raises eyebrows.  It is not normal professional business decision, but likely a strategic decision by Quek for something else that we don't know.   A non-zero risk is that it may not be for HLIND benefit per se if one goes by history, but I really have no clue what he is thinking.

3. Average Dividend Payout ratio is nice, around 60% - that's almost the sweet spot.
One time in 2017, it earned less but chose to raise dividends - I like this kind of dividend management.
However, given the huge growth in cash balance, if it does a regular Special Dividend, then, I would give top marks for Dividend management.  However, it hasn't done this and is really long over-due given how much that Cash Balance has grown.  Hence, it's not run as professionally as I like, but it's not a strong complain.

4. This business is under-valued (except for the high Net Cash).  The business is available for a low P/E of 5 (excluding Net Cash), when it grows Net Cash at 33% CAGR.   Clearly under-valued.

Market Response to this Rising Cash

Up to 2020, the fast rising Net Cash coincided with stock price rising massively.
But market is forward looking.  When COVID pandemic came, market already anticipated a fall, long before the fall actually happens.

My Investment Thesis

The best investment thesis jumps out at you, and HLIND certainly jumps out.

1. HLIND Dividend yield is attractive - the yield is double FD rate.  No complaints here!

2. HLIND stock is under-valued.  

3. A must own stock for long term dividend investors.  If earnings grow, dividends grow.

4. Own it when it is cheap.  This reduces your odds of losing.  Remember Buffett rule.

5. I would like this company to do more with the Cash Balance i.e. give back to shareholders because it is not natural to hoard for 8-9 years or longer.   After 3 years, one should already start thinking about Special Dividends, unless it has plans to use this, but this company is not very transparent, leading to questions about whether Quek has his own plans for this cash that is outside/may not necessarily benefit HLIND shareholderss (one would argue that if so, he would have already gave to shareholders via higher dividends, but chose not to do so).  At the very least, it should explain, give a bit more transparency, rather than leading investors to speculate.

6. So, it's not a question of not owning but how large a size.

7. If neutral position size is 3% capital, then, this one to be safe is maybe around 3% capital.

Reason to position higher = the Triangle Consolidation - something is about to happen in the next 1-2 years.

Reason not to position higher = Can you really trust Quek given if he really cared about shareholders, why aren't him sharing more of the RM1.6 billion cash over the past 8-9 years?  What if the triangle consolidation breakout is to the downside, after Quek does something else?

Remember Buffett Rule No 1 - Not lose money.

Never let Greed decides.  Stay professional, be rational, investment is best done when it is most business-like.


LCTITAN - Quarterly Update

My previous article here .  Last week, LCTITAN announced its quarterly result.  We saw 8 consecutive quarters of losses totalling 108 sen.  ...